Content Production Velocity Benchmarks by Team Size
Measure content output against team size, not arbitrary benchmarks pulled from elsewhere.
Content velocity benchmarks are useless without a size baseline. What counts as strong output for a two-person team reads as failure at fifteen people, and most teams have never bothered to map where they actually sit before measuring themselves against a number pulled from somewhere else.
Velocity is not a count of assets published in a month. It measures how fast and how efficiently content moves through the full lifecycle, from the first idea to the point where someone checks whether the piece actually worked. A team that ships forty posts against briefs nobody vetted, ranking for nothing and answering no question a customer was asking, has produced cost, not output. Raw counts without calibration tell you nothing about whether the work moved the business forward.
Three sub-measures make velocity usable instead of decorative. Production throughput is the raw rate of assets moving through the pipeline. Topic velocity tracks how fast a team moves from a gap in the market to a published piece that closes it. Refresh velocity tracks how fast aging content gets updated before it decays out of relevant search results. Tracking only one of these makes the picture lie: a team can post fast and still miss the topics that matter, or hit the right topics and let the archive rot underneath them.
Digital Applied's guide states that benchmarks without team-size calibration are "misleading by default." Not sometimes misleading. Misleading as the starting condition, before anyone has done anything wrong. What follows is a diagnostic: a way to place a team against a size-matched target and understand what the gap actually means, and, where the data points one direction over another, a plain statement of which one.
Three forces that made calibrated velocity measurement urgent in 2025-2026
Three separate shifts collided at once, and each on its own would have forced a rethink of how content teams measure themselves.
The first is AI-assisted drafting. It collapsed the marginal cost of producing a publishable post, breaking every legacy benchmark built during the era when a blog post took a writer most of a day. Digital Applied's 2026 guide treats this as the starting fact of the current landscape: the old cost-per-post math no longer applies.
The second is citation share, a discoverability axis that barely existed two years ago. Generative search engines route user intent through citations rather than blue links, and those citations stay invisible to the session-counting dashboards most teams inherited from the organic-search era. Averi's State of AI in Marketing 2026 report found AI Overviews appeared on 48% of Google queries as of April 2026, up from 31% in February 2025. Ahrefs data cited in writer.com's GEO/AEO guide shows the downstream effect: click-through rate on a top-ranking page for AI Overview keywords fell from 7.3% to 1.6%. Rank first today and the audience that ranking used to guarantee has mostly gone somewhere else, into the AI Overview box itself.
The third force is executive scrutiny. Marketing spend now gets reviewed in the same language finance and operations use everywhere else: throughput, defect rate, lead time, yield. A monthly post count doesn't survive that conversation on its own, and teams that keep reporting it as their headline number are going to keep losing the budget argument.
How team size scales with company stage, the baseline before benchmarks mean anything
Digital Applied pulled data from more than 1,000 content-ops teams, drawing on the Content Marketing Institute's 2026 research, the CMA, the Welcome State of Content Ops report, Gartner's CMO survey, and its own client telemetry. The pattern holds steady enough to build on.
At $10M in annual recurring revenue, roughly the early-growth or Series A stage, teams run on about 3.2 dedicated content-ops FTEs. At $250M ARR, an enterprise running a multi-format publishing engine, that number climbs to roughly 18.7. In between, the ratio holds close to one dedicated content-ops FTE for every $6M of ARR, all the way up to the $250M mark. Past $500M, the curve flattens: large enterprises get more out of process design and tooling than out of adding headcount, and regional satellite teams tend to absorb new coverage needs rather than trigger central hiring.
These figures count dedicated content-ops FTEs only, excluding partial-allocation contributors sitting in product marketing, brand, comms, or RevOps who spend some fraction of their time on content. Anything less strict breaks the comparison before it starts.
Headcount alone hides a shift that matters just as much: the mix of roles inside it. On AI-mature teams, the ratio of strategist to editor to writer moved from roughly 1:1:3 in 2023 to 1:2:1 in 2026. Editor hours grew because AI drafting front-loads volume straight into the review queue. Writer hours shrank because the first-draft stage compressed. Most teams that look understaffed against a size-matched benchmark have a staffing-shape problem, not a headcount shortage. They're running a 2023 org chart against 2026 volume, a staffing-shape problem dressed up as a headcount problem.
Solo operators and small freelance arrangements: what realistic output looks like at one to three people
Everestx's comparison of agency versus freelancer output puts the one-person ceiling at four to eight high-quality long-form articles a month, alongside strategy and optimization work. Digital Applied's benchmark guide puts cycle time from brief approval to publication at 3 to 5 days at this scale.
The ceiling gets clearer against a full year. Averi's 2026 true-cost analysis found that an AI content engine can produce 120 to 300 articles over twelve months, against roughly 72 for a typical freelance arrangement over the same period. That gap isn't a knock on freelancers. It marks where the structural ceiling sits for one person working alone, no matter how good the tools on the desktop are.
The real constraint at this scale is the total absence of parallel review capacity, not talent or access to AI drafting tools. It's the total absence of parallel review capacity. One person writes, edits, and checks their own work in sequence, so cycle time, not drafting speed, becomes the limit on everything downstream. Averi's 2026 report finds that roughly half of marketing teams are at Level 1 AI maturity, running isolated tools with inconsistent results, a pattern that is especially visible at smaller team scales.
Strong performance here means holding a steady 4-to-8 pieces a month, keeping cycle time under 5 days, and maintaining a refresh cadence so older pieces don't quietly go stale while attention stays locked on new drafts.
Small pods of four to eight people: where specialization begins and output expectations shift sharply
Somewhere around four people, roles start splitting apart. Clustermagic's guide to building content teams describes the typical structure here: a content manager, a strategist, two or three in-house writers, and dedicated SEO support, usually with a content designer added rather than borrowed from another team ad hoc.
This structure becomes necessary once output crosses a specific line. Everestx puts it at 12-plus articles, four-plus videos, plus regular social content and email copy each month, a volume that needs the parallel capacity a pod offers rather than the sequential output of one person. VisibilityStack's benchmark data found that most successful B2B teams publish two to four pieces a week at this stage, and uneven cadence causes quality and adoption to slip fast, so consistency is what sustains both.
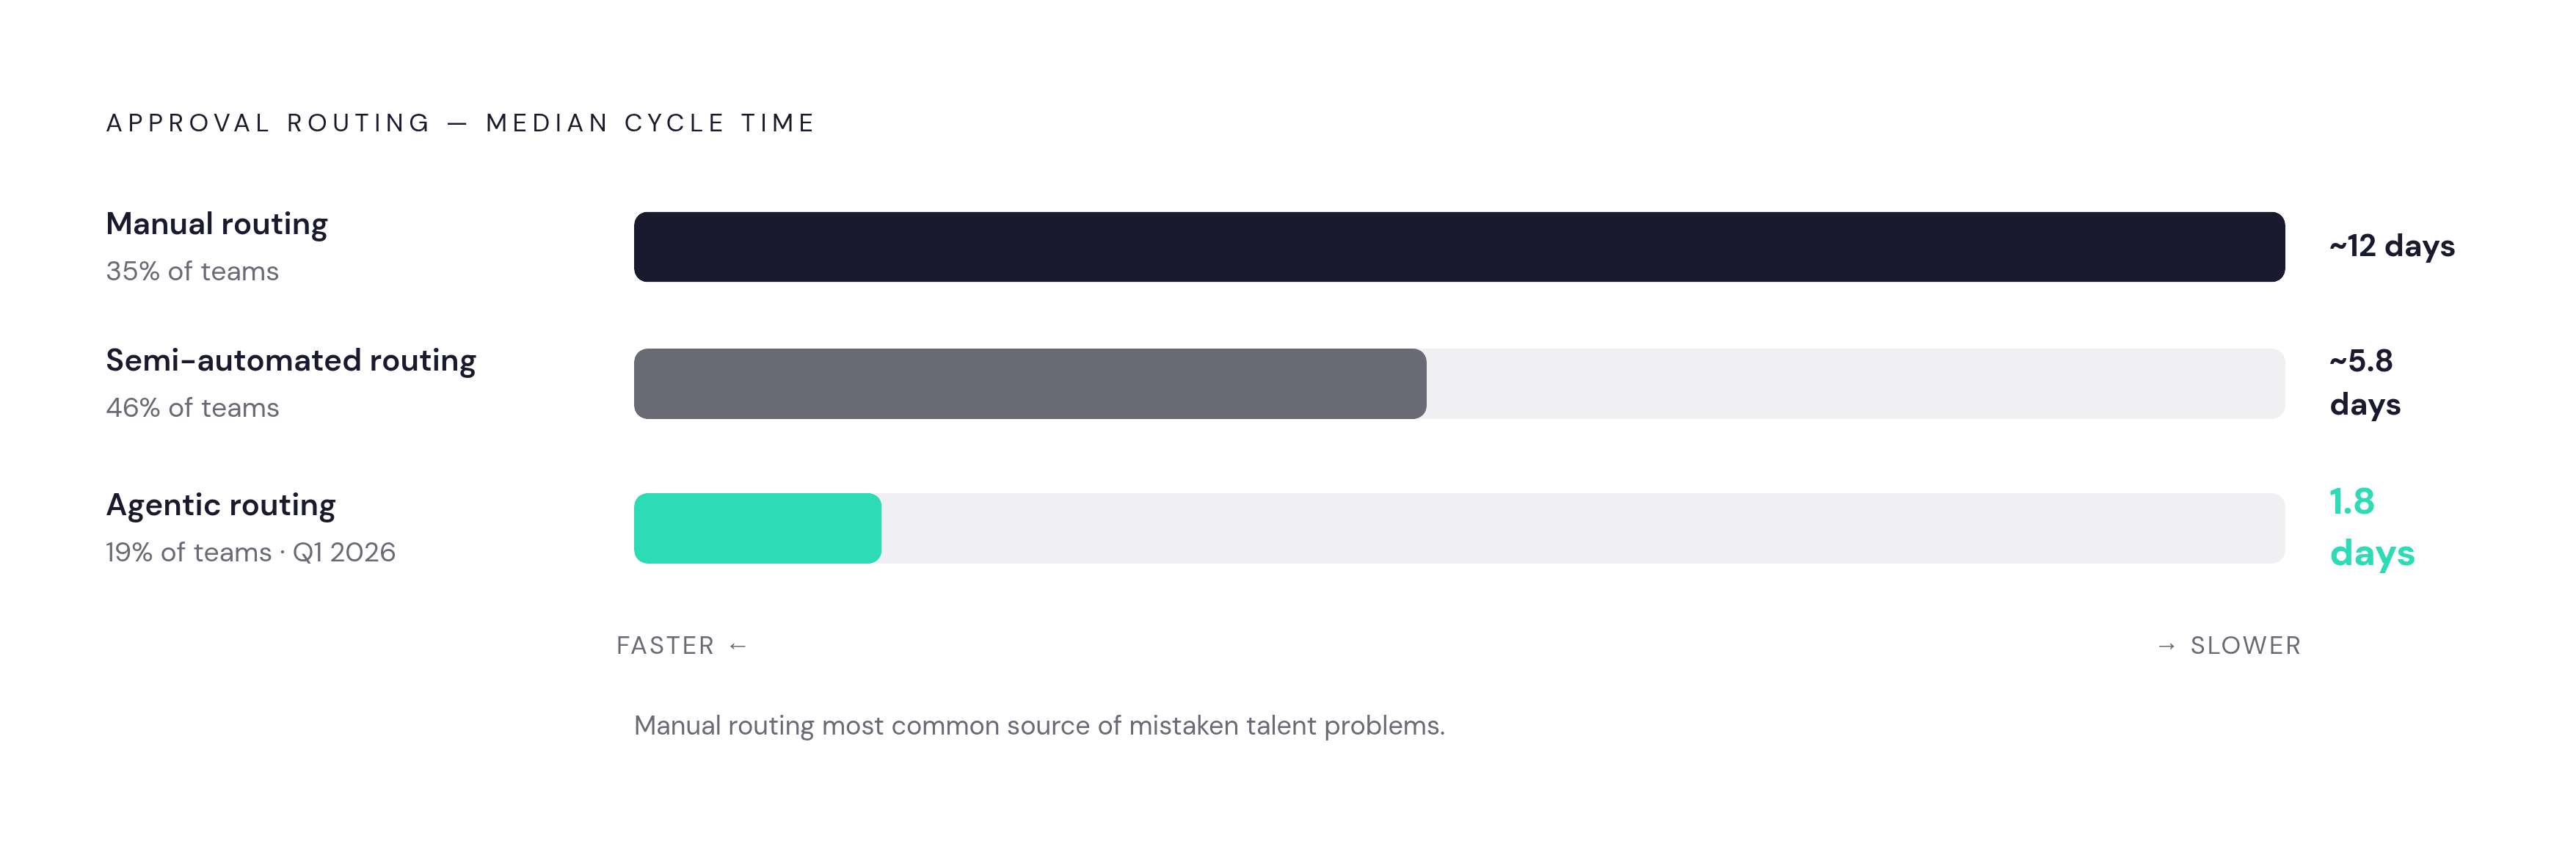
Pods rarely stall on drafting capacity. They stall on approval chains. Once four or more people touch a single piece before it goes live, workflow design becomes the dominant velocity lever; another writer would not move the number. Digital Applied's Q1 2026 data found that semi-automated routing, run by roughly 46% of teams, is the most common configuration in 2026, and it fits pod-scale teams well. A pod still running fully manual approval should fix that before it hires anyone else, full stop.
Agencies running a pod against multiple client brands hit a version of this problem that compounds fast. Conbersa's research found that a fleet of ten client accounts needs roughly 8 to 10 times the content volume of a single brand to hold the same per-account posting cadence, a multiplier that overwhelms a pod with no systematic repurposing process or automated routing in place.
Scale teams of nine or more: the structural features that separate top-decile output from median
Past nine people, the org chart gets a name attached to each function. Clustermagic describes the typical shape: a head of content owning the function overall, a managing editor running day-to-day workflow, writers each focused on a specific topic area or format, and dedicated ops, SEO, and design roles sitting inside the team rather than borrowed from elsewhere.
Digital Applied's dataset puts median long-form output at 14 pieces a month for mid-market teams around $50M ARR (roughly 8.4 FTEs), rising to 38 pieces a month for enterprise teams around $250M ARR (roughly 18.7 FTEs).
The real story sits in the gap between median and top-decile teams at the same headcount. Top-decile teams produce 3.2 times the median output at the exact same stage and team size, and AI tool adoption doesn't explain any of that gap. It's table stakes across the field now. The gap comes from approval-workflow design paired with AI-first ideation: teams pulling ahead redesigned how work moves, not just what tools touch it.
Growth-focused teams sometimes push well beyond the median output figures, and new sites may front-load publishing in the early months to build out search surface area fast. Scale alone doesn't mean any of it gets used well, though. Averi's report found that only about 15% of marketing teams operate at the highest AI maturity tier, running a purpose-built content engine with persistent brand context that compounds organic growth over time. Most large teams sit on more structural capacity than they actually use.
There's a budget story hiding in this data too. Digital Applied's 2026 numbers show cost-per-asset on AI-assisted teams fell 41% over two years, and at scale that saving rarely funds headcount cuts. It gets redistributed toward strategy and editing, and these two functions decide whether the extra capacity turns into better content or just more of it.
Approval cycle time: the largest single velocity lever regardless of team size
Digital Applied's Q1 2026 dataset lands on one finding that cuts across every team size discussed so far: the gap between agentic and manual approval routing is the single largest tempo lever measured, bigger than AI-assisted drafting, bigger than consolidating a tool stack, bigger than adding headcount.
Agentic routing, where AI handles routing, draft assembly, change detection, and stakeholder notifications while a human reviews only the final compiled output, runs a median cycle time of 1.8 days. Roughly 19% of teams had adopted this by Q1 2026, up sharply from about 4% a year before. Semi-automated routing is in the middle and remains the most common pattern industry-wide, at roughly 46% of teams. Manual routing is still common, and it's also the slowest configuration measured. Teams stuck there are the ones most likely to mistake a workflow problem for a talent problem, and hiring their way out of it almost never works.
When cycle time stretches well beyond a week, it signals a structural problem. Adding another writer to an extended approval chain does nothing, because the writer was never the bottleneck to begin with.
Measured over a year, the compounding effect appears in ships and rankings. At 50 long-form pieces a month, a team running agentic routing ships roughly 130 calendar days earlier across the year than a team stuck on manual routing. That's the gap between a team that owns a topic cluster because it published first and a team still reacting to whoever got there ahead of it.
For a pod-sized team still running fully manual approval, moving to semi-automated routing beats any new hire or drafting tool on the table. Enterprise teams face their own version of this risk in approval gridlock: Linear approval chains running through legal, brand, compliance, and executive sign-off can add substantial time to a single piece, and by the time it clears every gate, the strategic reason it was written in the first place may no longer hold.
AI adoption tier and team size: their interaction in producing or suppressing velocity
Averi's report splits marketing teams into three AI maturity tiers, and the distribution is lopsided. Roughly 50% of teams fall into Level 1, running isolated AI tools with inconsistent results. Level 2, multiple AI tools stitched together through manual workflows, delivers measurable improvement but at a high time cost, and covers about 30%. Level 3, a purpose-built content engine with persistent brand context producing compound organic growth, covers only about 15%.
Adoption of AI for first drafts is close to universal now. Digital Applied's data shows AI-assisted first drafts reached 68% of all long-form content in Q1 2026, up from just 22% in 2023, and 86% of blog posts specifically. Adoption and maturity aren't the same thing, and the gap between them decides whether that adoption produces real velocity or just a fuller review queue. VisibilityStack's research found that AI tools can push content velocity 3 to 5 times higher while holding quality standards for search, but only for teams that fixed their approval bottleneck first. Drafting speed without matching routing speed doesn't produce velocity. It produces backlog, stacked in front of the same review team that existed before the drafts got faster.
At 86% penetration, having access to an AI drafting tool has stopped being a differentiator. What separates teams now is how the rest of the workflow wraps around that AI output, which loops back to the role-mix shift covered earlier: the move from a 1:1:3 to a 1:2:1 strategist-to-editor-to-writer ratio. A team still running the 2023 ratio is trying to push a 2026 volume of AI-assisted drafts through an editing bench built for a different era, and that mismatch is often the hidden reason a team feels like it's drowning despite owning more tools than ever.
Knowing which AI maturity tier a team actually is at settles a real question: is underperformance against a size-matched benchmark structural, because roles and workflow haven't caught up, or operational, because the tools themselves aren't being used well? Those two problems need entirely different fixes, and confusing one for the other wastes a full budget cycle chasing the wrong repair.
Velocity benchmark gaps in teams managing multiple brands or clients
Every benchmark discussed so far assumes a single brand, a single approval chain, and a single editorial calendar, something agencies and multi-brand teams never have. Once a team manages a portfolio, the math changes in ways standard benchmarks don't capture.
Conbersa's 2026 research quantifies fleet content demand directly: an operation running ten client accounts needs roughly 8 to 10 times the content volume of a single median brand just to hold the same posting cadence per account. That volume requirement overwhelms most production workflows built with one brand in mind. Hootsuite's Social Trends survey, cited in Conbersa's report, found that 58% of marketers name content production volume as their primary constraint on social performance, ahead of budget, team size, or strategy.
Per-platform numbers make the scale concrete. Conbersa's data, drawing on Hootsuite's 2026 figures, puts median single-brand posting frequency at 1.2 posts a day on TikTok and 0.8 posts a day on Instagram. Multiplying either number by ten accounts makes the production requirement a systems question, because a staffing fix alone can't cover volume at that scale.
Content doesn't scale in a straight line across clients, either. Each additional account demands its own creative effort, and that effort compounds as the portfolio grows rather than averaging out. That's the specific reason per-brand benchmarks understate what agency production teams actually need to hit.
Proportional headcount growth isn't the fix. Most agencies that have tried it already know why: hiring doesn't scale fast enough to match account growth, and it doesn't fix the creative-output shortfall that hiring's slow pace itself compounds. The higher-leverage response is repurposing, turning one long-form asset into multiple short-form derivatives across formats, a structural fix rather than a staffing one. What agency teams actually need, and what generic velocity benchmarks don't provide, is per-client velocity tracking, analytics that roll up across the whole portfolio, and reporting that flags which clients are falling behind pace before it turns into a renewal conversation.
Velocity and AI
AI changed content velocity by attacking the cost of a first draft, not by fixing the rest of the pipeline on its own. That distinction runs through every team size and every benchmark covered above. Drafting got dramatically cheaper and faster starting around 2023, and by Q1 2026, AI assistance touched 68% of long-form first drafts and 86% of blog posts specifically. None of that automatically buys a team more velocity, because velocity is a property of the whole lifecycle, from idea to published piece to performance check, not a property of the drafting stage alone.
The top-decile performers, the ones producing 3.2 times the median output at matched headcount, got there by redesigning approval workflow and ideation around AI output, not by adopting more AI tools than everyone else. AI tool access is table stakes now. Workflow design around that access is where the separation actually happens, and any team still treating tool adoption as the finish line is measuring the wrong thing.
The discoverability shift from earlier in this piece bites hardest here. A team pushing more machine-drafted volume into a search landscape where AI Overviews already answer 48% of queries, and where a #1 ranking now pulls a 1.6% click-through rate instead of 7.3%, needs each piece to do more work than it used to. Faster drafting into a shrinking traffic surface isn't a win by itself. It becomes one only when the routing, the review, and the citation strategy around that drafting catch up to match it.