How to Measure Marketing Campaign Effectiveness Beyond Last-Click
Stop trusting last-click attribution and layer three measurement methods instead.

Last-click attribution gives 100% of the credit to whatever touchpoint happened right before someone converts, no matter what came before it. It survives because it's fast, free, and built into every ad platform's dashboard. That convenience is now costing marketing teams real money, and the fix is layering multiple measurement methods together. It's running three different measurement methods at once, each answering a question the others can't.
Picture a buyer who sees a Facebook ad, searches the brand name a week later, opens a follow-up email, then clicks a Google search ad and buys. Last-click hands 100% of the credit to that final search ad. The Facebook ad, the branded search, the email: gone, as if none of it happened. Worse, Every major ad platform runs its own last-touch logic and will claim credit for the same sale in its own dashboard. Adding up the "conversions" reported across three platforms makes the total exceed actual sales, sometimes by a wide margin. That's conversion inflation, and it's the mechanism behind a lot of the inflated ROAS numbers driving real budget decisions right now.
How broken measurement is costing marketing teams real budget
TransUnion's 2025 report found 60% of marketers face internal skepticism from stakeholders about their own metrics, and about 29% have had up to a fifth of their budget reallocated because leadership didn't trust the measurement behind it. Marketing is losing its seat at the budget table because the numbers it hands up don't hold together under a CFO's questioning.
Fewer than 40% of marketers say they can accurately measure overall marketing ROI. Privacy changes made that worse: they've wiped out an estimated 30 to 40% of previously trackable conversions, so last-click now describes an even smaller, less representative slice of the buyer journey than it did five years ago. Chasing precision on a shrinking dataset is how a team ends up confident and wrong at the same time.
Most teams respond to that pressure by measuring what's convenient instead of what's true. The gap between what's easy to measure and what actually matters is well documented, and that shortcut is precisely how budget gets misallocated without anyone catching it in the dashboard. The gap between what a dashboard shows and what's actually happening in the market is where budget dies quietly, reallocated on a hunch dressed up as a KPI.
Three measurement methods, three different questions they answer
Multi-touch attribution, marketing mix modeling, and incrementality testing get talked about like rival products competing for the same job. They aren't rivals, and treating them that way is the first mistake most teams make. Each one answers a different question, and none of them can answer the other two's questions no matter how well it's built.
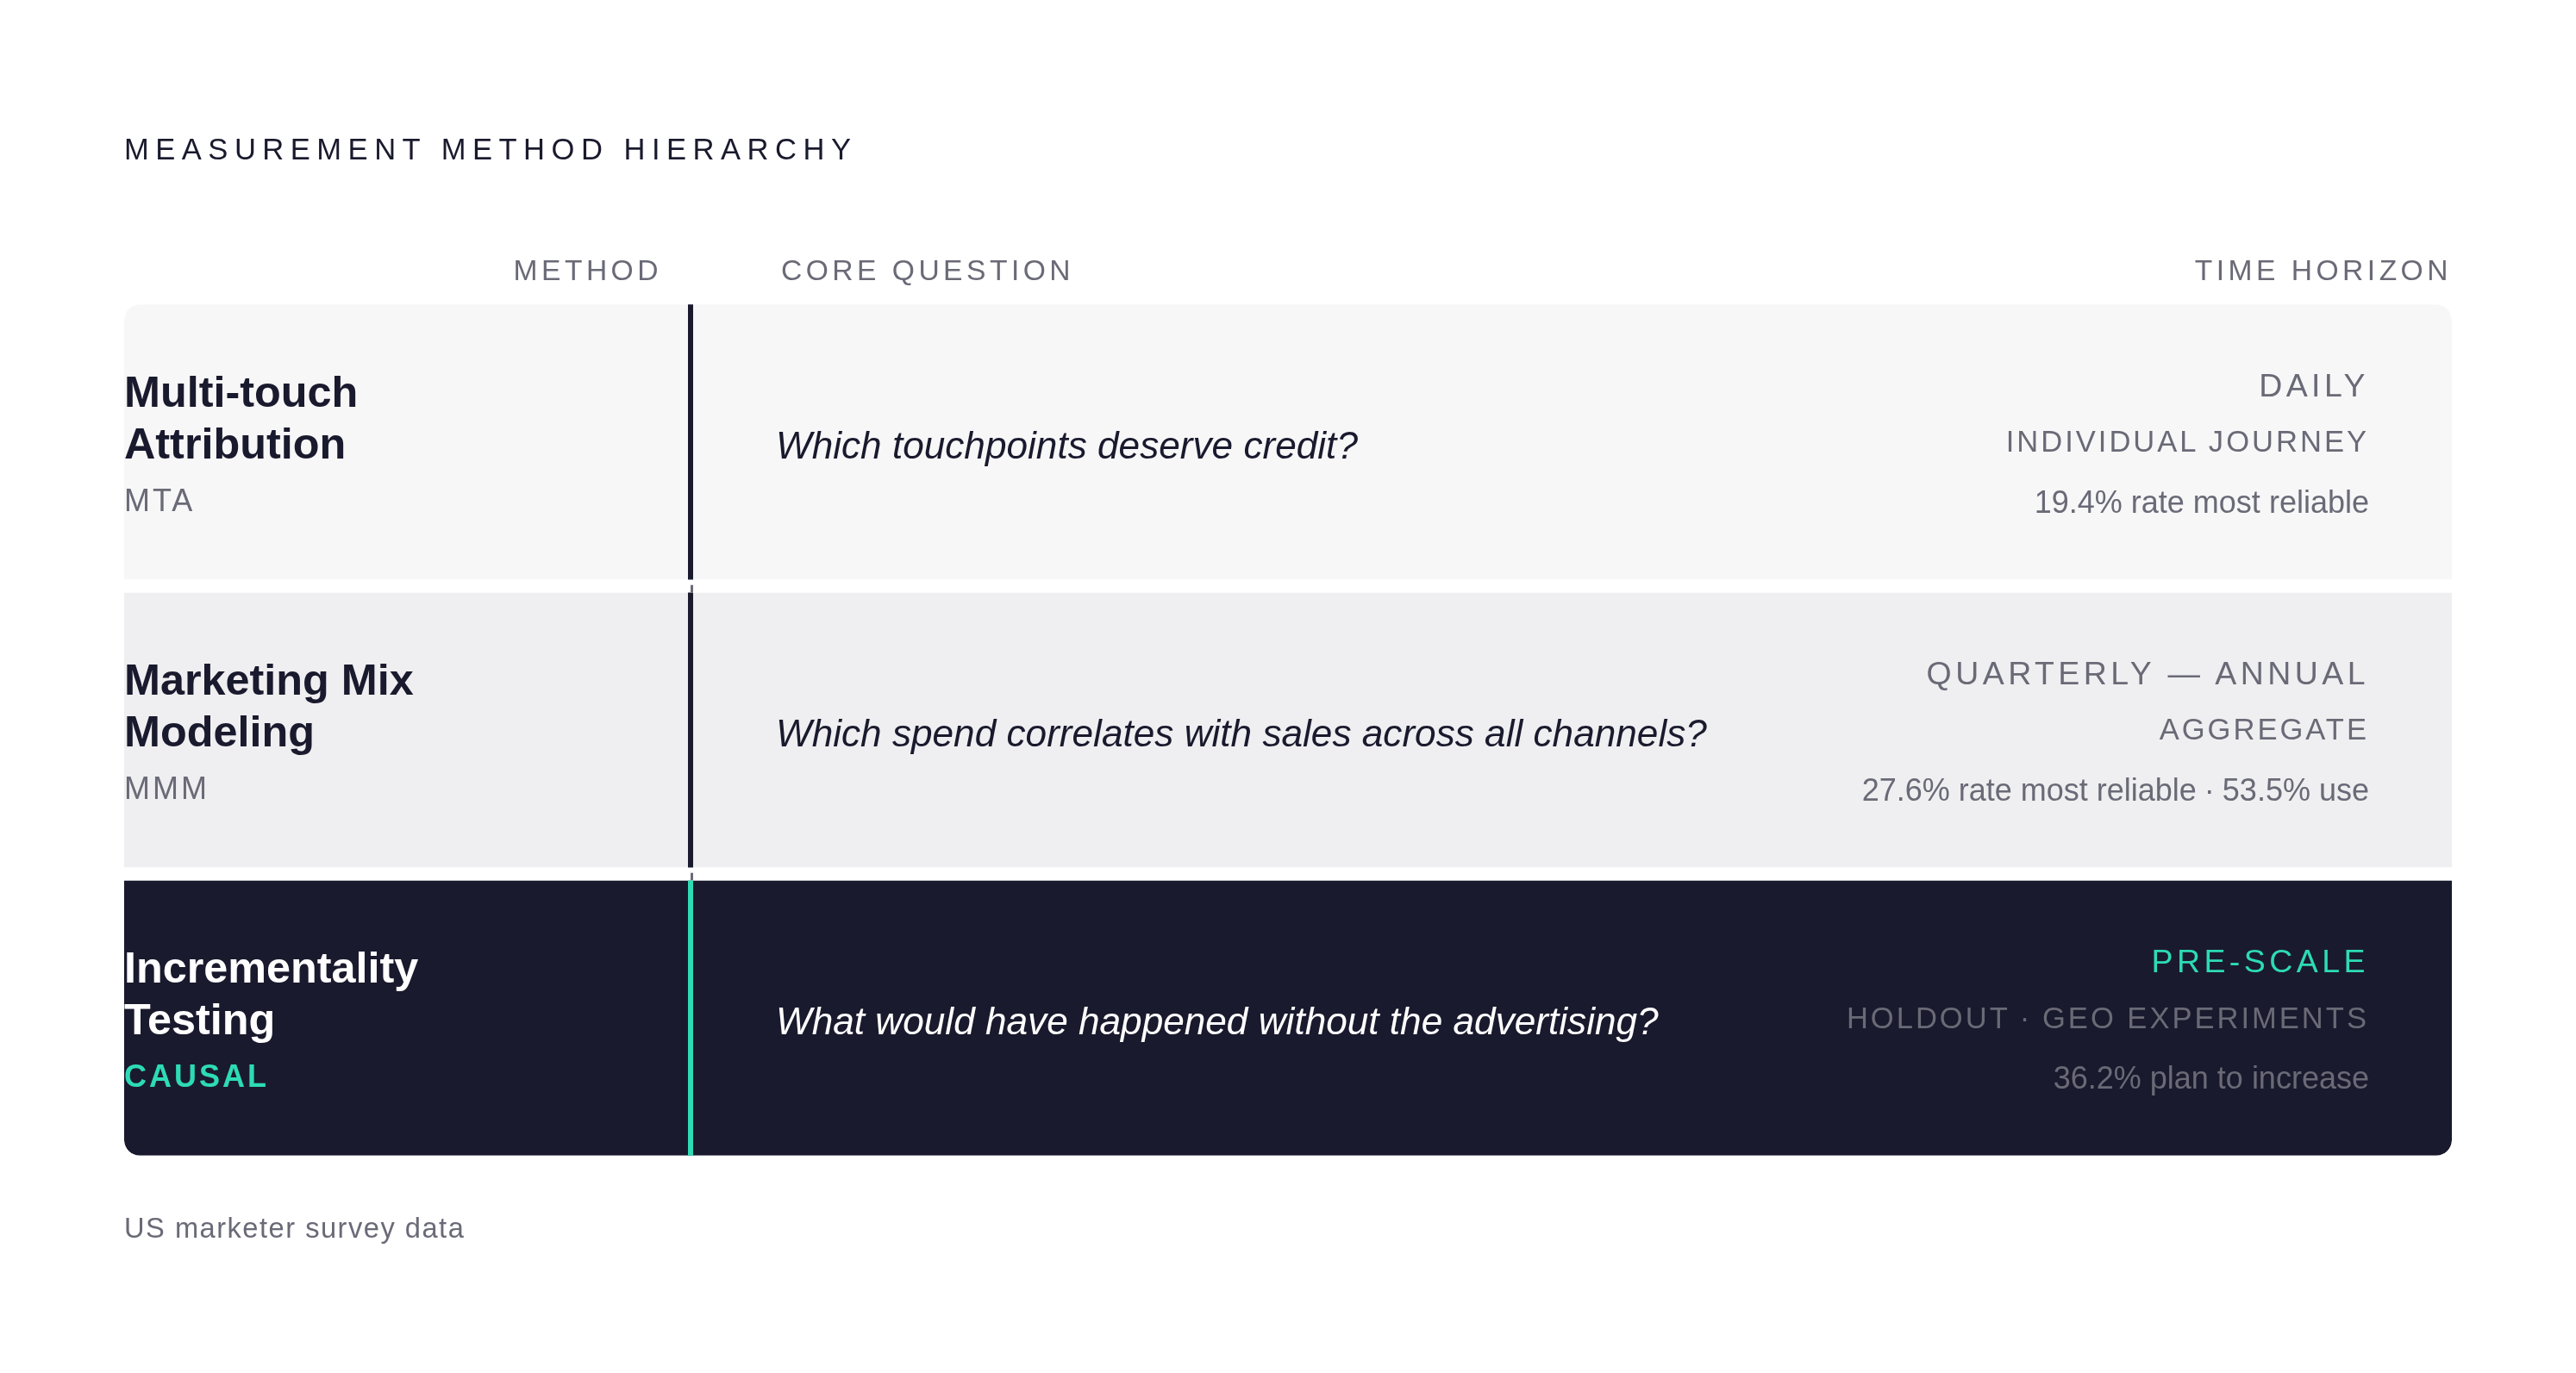
Multi-touch attribution (MTA) asks which touchpoints showed up before a conversion and how much credit each one deserves. It works at the level of an individual buyer's journey, which makes it genuinely useful for day-to-day optimization inside digital channels that are already validated elsewhere. Its blind spot is structural: it only sees what it can track, so cookieless environments, offline channels, and anything happening inside an AI chat interface simply don't exist in its data.
Marketing mix modeling (MMM) asks a bigger question: which spend correlates with sales results in aggregate, across every channel including offline ones like TV and out-of-home. It runs on historical data spanning quarters or years, which makes it the right tool for annual and quarterly budget calls, not daily tweaks. Adoption has moved past the early-adopter phase: an EMARKETER/Snap survey found 53.5% of US marketers already use MMM, and roughly 27.6% now rate it their most reliable methodology, ahead of MTA's 19.4%. But below a substantial level of annual media spend, MMM is premature, full stop. It needs two or more years of history and real variation in spend across several channels to produce confidence intervals worth acting on. Running it too early makes the output look scientific while resting on too little data to mean much.
Incrementality testing asks the most basic question of all: what would have happened if none of this advertising had run? It's the only method of the three that's actually causal, using holdout groups, geo experiments, and intent-to-treat designs instead of correlation. Treat it as the gold standard, because it's the only one of the three built to prove a channel deserves more spend before that spend gets committed, rather than justify spend after the fact. 36.2% of marketers plan to increase incrementality testing spend over the next year.
Layering the Three Methods into One Operating Framework
Teams getting this right in 2026 run all three in a defined hierarchy, using each one for the job it's actually good at, instead of picking a favorite and forcing it to answer questions it wasn't built for.
MMM sets the strategic backbone: the annual channel mix and overall budget envelope, drawn from aggregate historical patterns. Incrementality tests then validate that read by running against the largest or newest channels, confirming the correlation MMM found is actually causal before anyone scales spend on it. Google's own Meridian modeling tool is built around exactly this idea, using geo experiments to calibrate the model rather than trusting correlation alone. MTA sits at the bottom as the in-flight layer, giving daily directional signal inside digital channels the two layers above have already validated. It's the fastest feedback loop of the three, and speed is the whole point of putting it there.
That hierarchy maps onto a three-layer KPI pyramid a lot of teams skip past too quickly. Executive metrics are the top layer: revenue, pipeline, the numbers a CFO actually asks about. Operational campaign data is in the middle, showing channel-level contribution. Tactical platform indicators, like click-through rate or cost-per-click inside a single ad account, sit at the bottom. Each layer answers a different question for a different audience, and collapsing them into one report is how a KPI stops meaning anything. Organizations that run a digital marketing audit before setting KPIs report 40% higher accuracy in defining what "measurable" even means for their situation.
The part of the customer journey no attribution model currently sees
None of the three methods above, not MTA, not MMM, not incrementality testing, can see what happens when a buyer asks ChatGPT, Perplexity, Claude, or Google's AI Overviews to explain their options before ever touching a search bar or clicking an ad. That conversation is now a real part of how people evaluate brands, and it happens entirely outside the tracking infrastructure marketing has spent two decades building.
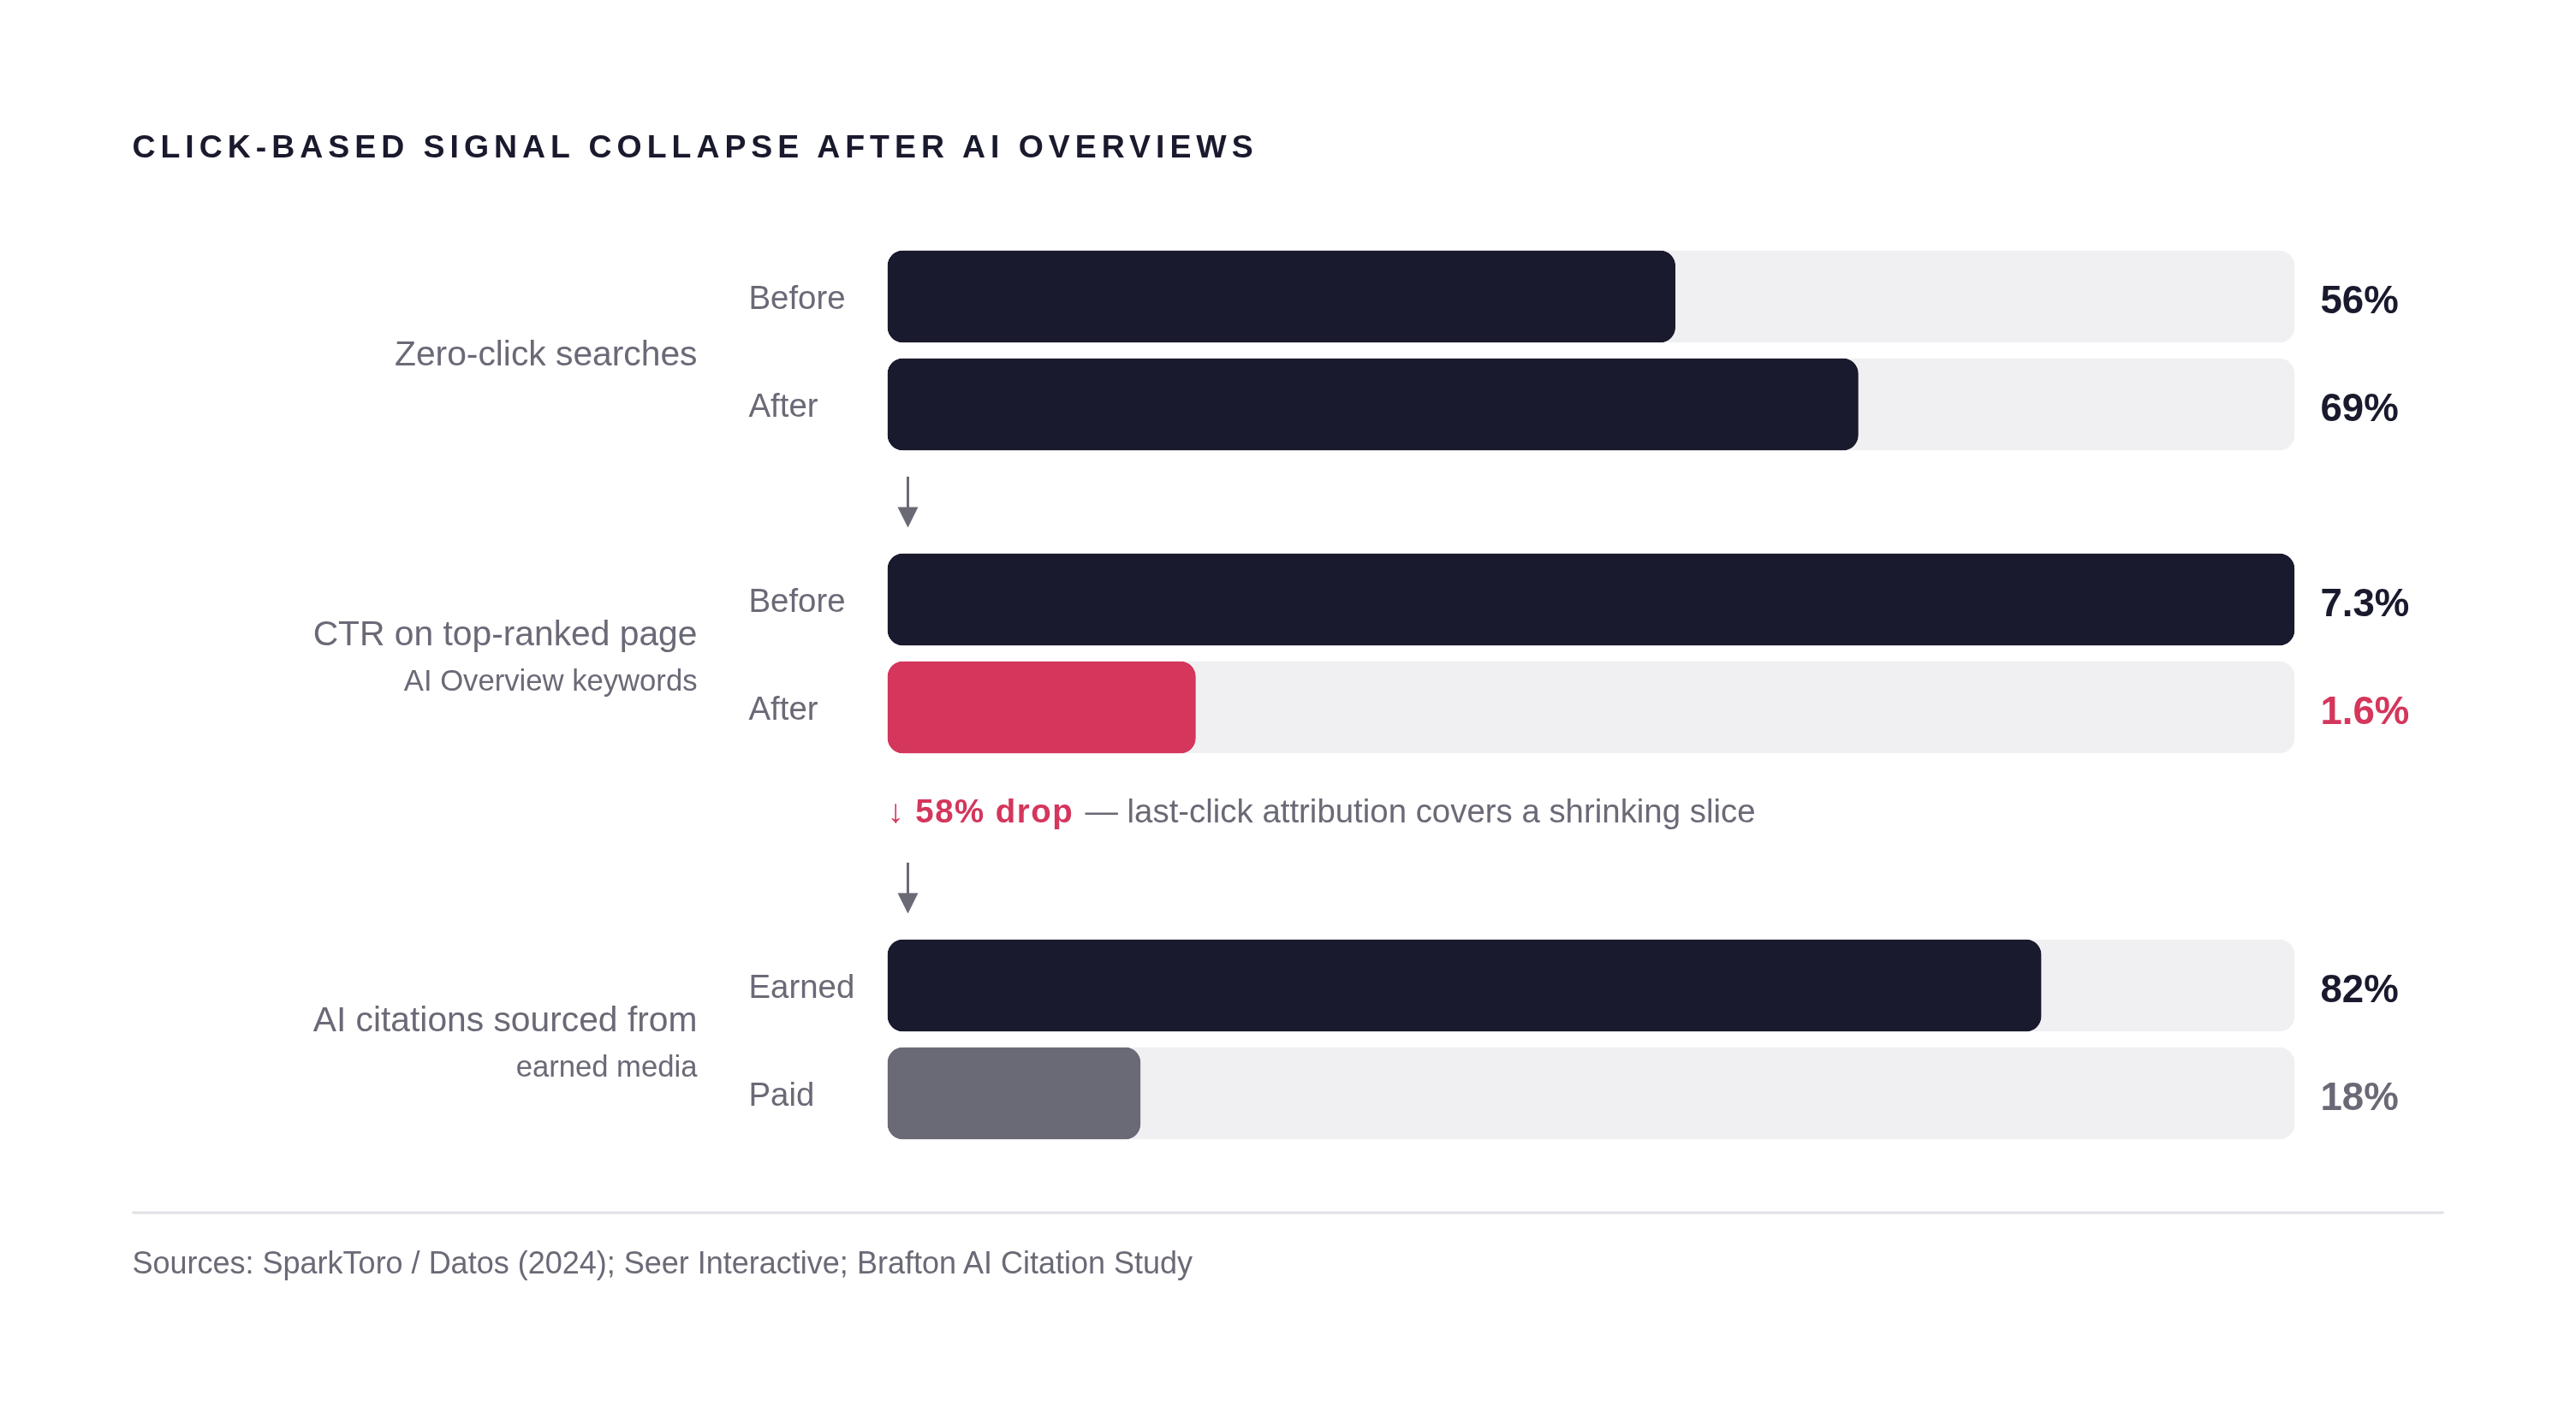
The scale of that shift stopped being a projection sometime around mid-2026. Gartner predicted traditional search engine volume would drop 25% by 2026, a trajectory consistent with the rapid changes already visible across search behavior. Where Google's AI Overviews appear on a search result, click-through rate for the page that used to rank first drops by up to 58%, falling from 7.3% to 1.6% on AI Overview keywords, based on a comparison of a large sample of keywords between December 2023 and December 2025. Zero-click searches on Google climbed from 56% to 69% in the year following the AI Overviews rollout. And when AI systems do cite a source in their answers, 82% of those citations come from earned media, not owned content and not paid placement. A brand doesn't get to buy its way into the answer. It has to earn a mention, the same way it earns a press citation.
Measuring brand presence in AI surfaces: the metrics that replace click counting
The discipline built to close this gap is called Generative Engine Optimization, or GEO: structuring content and brand presence so AI systems actually cite and recommend the brand inside their synthesized answers. That's a different job from Answer Engine Optimization (AEO), which aims to make a piece of content the direct answer a search engine surfaces. GEO doesn't need to be the answer. It needs to inform the blended answer the AI constructs from multiple sources. The target is influence.
GEO runs about 80% strategic work, meaning positioning, ecosystem presence, and brand authority, and only 20% technical execution. That ratio should shape how agencies scope and price this work. A GEO engagement built mostly around technical checklist items is solving the wrong fifth of the problem.
Peer-reviewed research out of Princeton (arXiv:2311.09735) tested which content techniques actually move the needle on AI visibility. Citing sources, adding direct quotations, adding statistics, and optimizing for fluency came out as the top performers, and content built with verifiable statistics and named citations showed 30 to 40% higher AI visibility than content without them.
None of this replaces SEO, and treating GEO as a replacement misreads how these systems actually work. Nearly 40% of Google's AI Overviews cite pages that already rank in the top 10 organic search results, and nearly 70% cite pages ranking somewhere in the top 100. The underlying principle is straightforward: Any agency selling GEO as a shortcut past search fundamentals is selling something that doesn't match how the engines actually behave.
Building the measurement system: the decisions that determine whether it works
Start from the decision leadership actually needs to make, not from the tool a vendor is selling. Budget allocation, channel mix, whether marketing is creating new demand or just harvesting demand that already existed: those are the questions the system needs to answer, and the tracking setup gets built backward from them.
For a team starting from last-click today, the first 30 days go to an honest audit: broken UTMs, missing CRM connections, channels with zero visibility. That's also when the three-layer KPI pyramid gets built and leadership signs off on what questions the system is actually meant to answer. Days 31 through 60 bring MTA online with real CRM integration across digital channels, start the historical data collection MMM will eventually need, and set up baseline monitoring for AI citation across the brand's key queries. Days 61 through 90 bring the first incrementality test, run on whichever channel takes the biggest chunk of spend, with MTA's findings calibrated against whatever that test finds. AI citation share joins the traditional performance numbers in reporting at this point too.
Organization size should decide which methods get weight, and smaller teams that skip this step usually build a system too heavy for what they can maintain. Below a substantial level of annual media spend, skip MMM for now and lean on MTA plus incrementality experiments instead. MMM needs history and spend variation smaller teams haven't accumulated yet, and forcing it early just produces a confident-looking number nobody should trust.
Stakeholder communication is where a lot of otherwise sound measurement systems fall apart, and the three-layer pyramid matters here as much as it does in the build. The executive layer shows revenue and pipeline impact, full stop. The operational layer shows channel contribution and incrementality results. The tactical layer, made up of platform-level metrics such as clicks and cost-per-click, stays inside the marketing team and never makes it into a board deck. Mixing those layers into a single report is one of the fastest ways measurement loses credibility with leadership: a CFO looking at a platform-level engagement metric next to pipeline revenue has no way to tell which number actually matters to the decision in front of them.