B2B SaaS CAC Benchmarks by Growth Stage and Segment
Fully loaded CAC only means something when matched to ACV, stage, and motion.

B2B SaaS customer acquisition cost benchmarks are useful only when they describe the business being measured. For investors and finance leaders reading CAC in 2026, the right comparison combines growth stage, go-to-market motion, and industry vertical, with annual contract value setting the economic boundary. The goal is to understand whether acquisition spending can pay back on terms the business can sustain.
Why a single CAC number tells you almost nothing
A founder sees a competitor’s CAC and panics because their own is higher. A CFO sees the same figure and relaxes because theirs is lower. Either reaction can be wrong. Without knowing what the competitor sells, how it acquires customers, and which costs it counts, the comparison says little about efficiency.
Median B2B SaaS CAC in 2026 spans roughly $200 for self-serve, low-ACV products to more than $15,000 for enterprise deals. Published benchmarks often blend GTM motions and ARR stages, producing averages that describe almost no company accurately. Accounting differences widen the gap. Counting only ad spend understates true SaaS CAC by a factor of one-and-a-half to four times, so a fully loaded figure can look expensive against an incomplete one.
What if the reader wants only a quick gut check? Speed does not make a mismatched comparison useful. A benchmark calibrated to the wrong segment can encourage spending that the business cannot support, or make reasonable acquisition costs look excessive.
How to calculate CAC in a way investors will accept
Fully loaded CAC counts what the business spends on ads across paid channels, along with sales salaries, commissions, and SDR costs. It also includes marketing tools, CRM software, agency fees, content production, events, and customer success costs tied to onboarding. These costs need to be included before a comparison with investor benchmarks can begin.
CAC payback is the main unit-economics metric investors use in 2026 because it ties acquisition cost to deal size and gross margin. It divides CAC by gross-margin-adjusted monthly recurring revenue per customer. LTV:CAC instead divides gross-margin-adjusted lifetime value by fully loaded CAC. The lifetime-value calculation uses ARR per customer multiplied by gross margin and divided by churn rate. Using revenue without adjusting for gross margin overstates LTV by roughly thirty to fifty percent.
The dashboard extends beyond those two measures. The Magic Number divides net new ARR by what was spent on sales and marketing in the prior quarter, while the Rule of 40 adds revenue growth rate to EBITDA margin. For board reporting, the recommendation is to present these measures together. A blended ARR-cohort average can support competitive benchmarking, but it does not remove the requirement to report fully loaded costs.
What ACV sets before stage or motion enter the picture
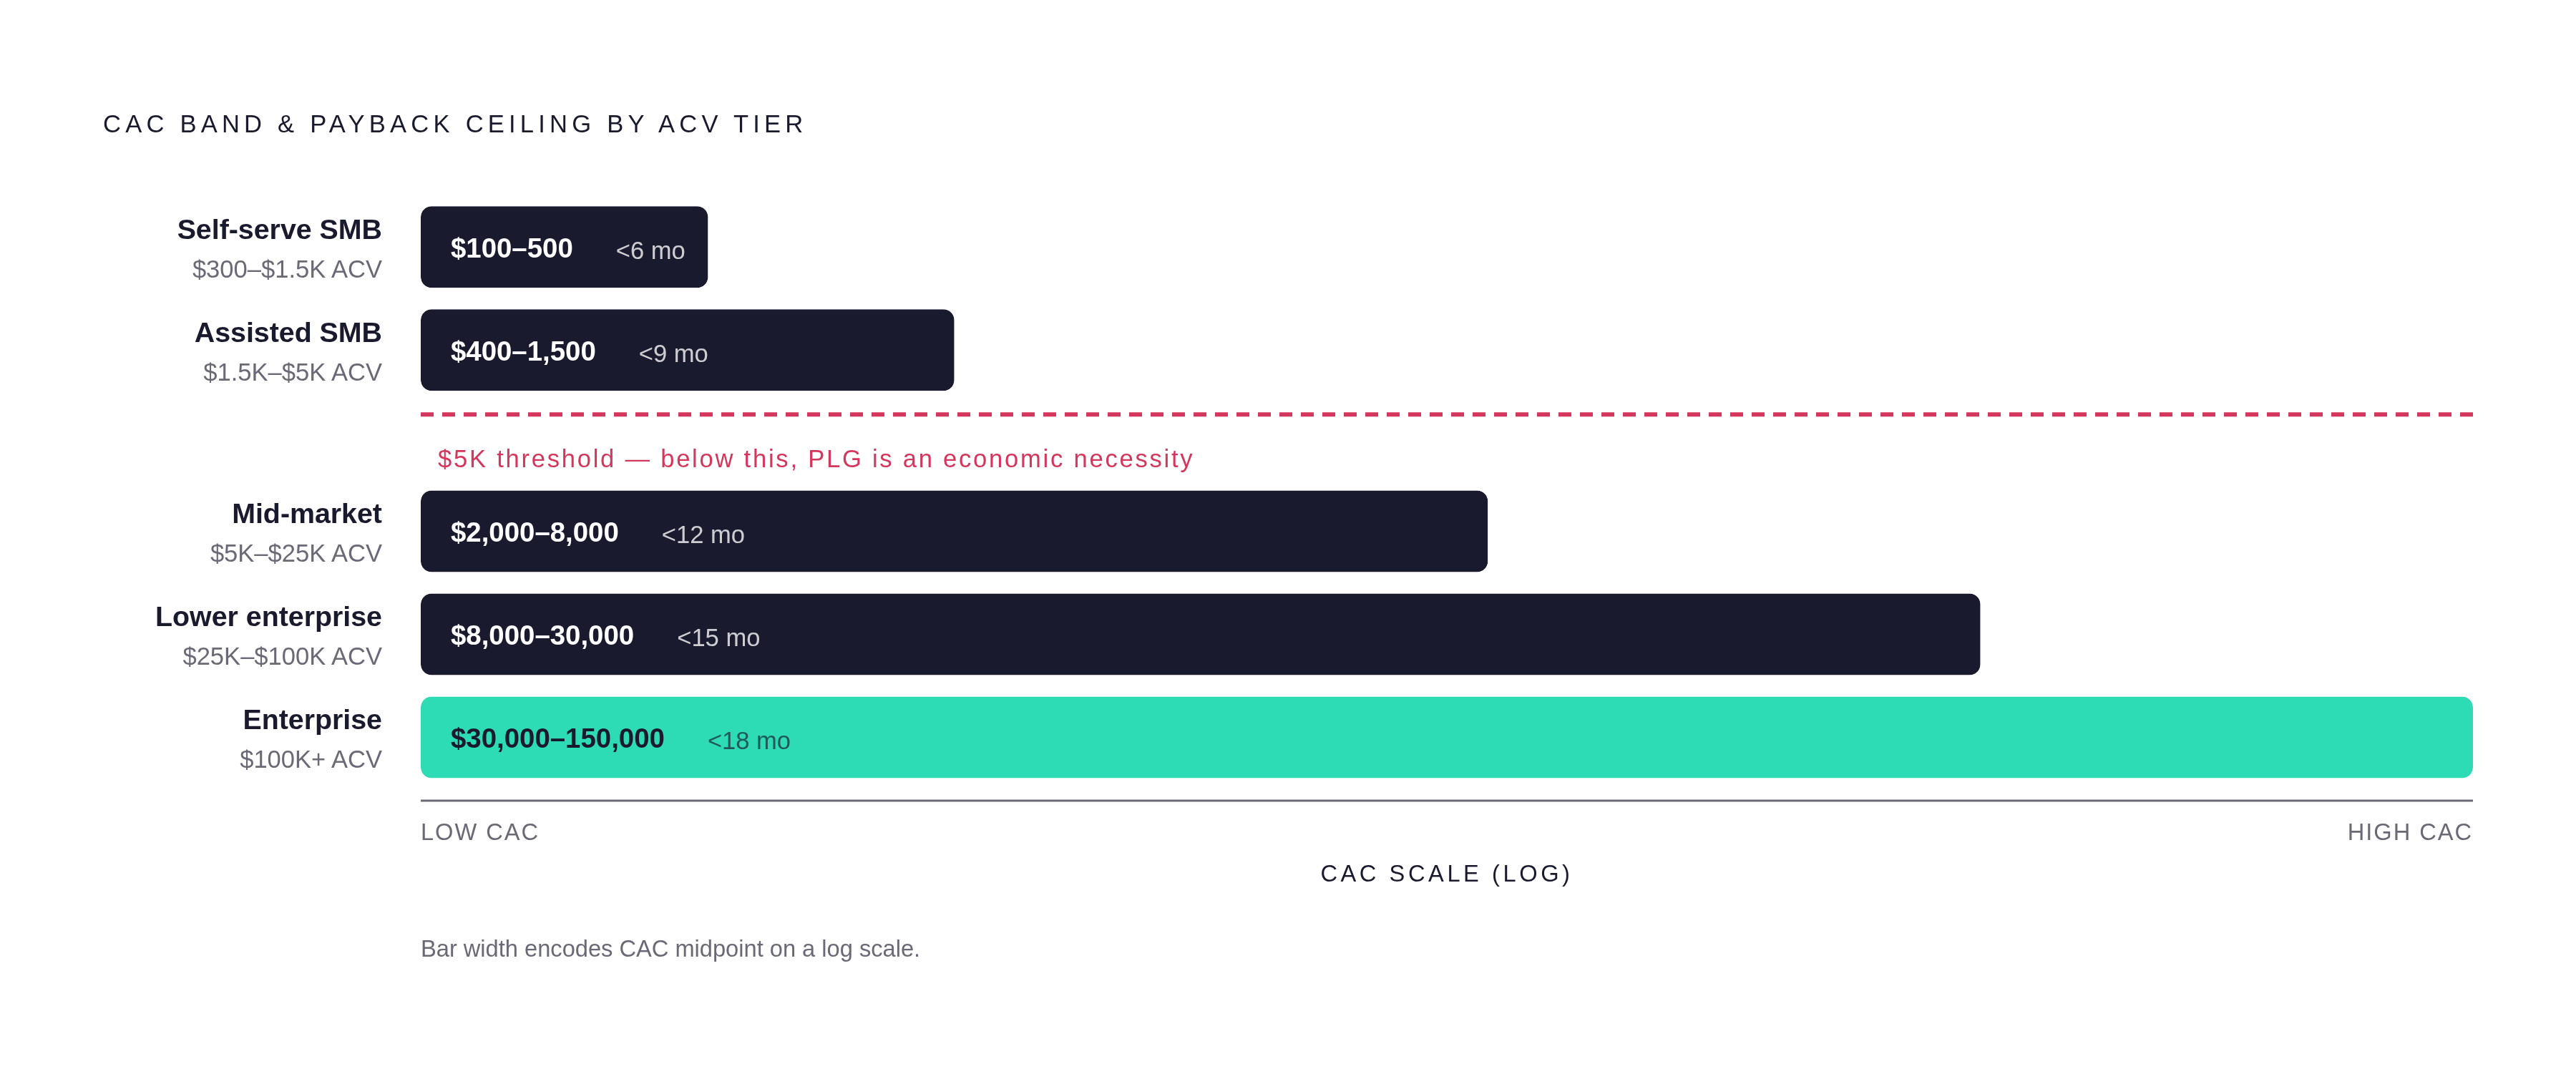
Annual contract value establishes the first constraint because acquisition spending must be supported by what a customer can contribute over its lifetime. A peer’s spending cannot change that arithmetic. The CAC-to-ACV ratio and payback period therefore say more than the dollar figure alone. The acceptable spending bands rise with ACV, but so do the expectations attached to those contracts.
For self-serve SMB products with ACV of $300–$1,500, the acceptable CAC ceiling is $100–$500, with payback under six months. Assisted SMB products at $1,500–$5,000 ACV have a $400–$1,500 CAC band and a target under nine months. Mid-market products at $5,000–$25,000 ACV move to $2,000–$8,000 CAC and payback under twelve months.
Lower-enterprise contracts at $25,000–$100,000 ACV support a CAC band of $8,000–$30,000, with payback under fifteen months. Enterprise contracts at $100,000+ ACV have a $30,000–$150,000 band and a target under eighteen months. The deal still needs to repay its acquisition cost within the relevant payback band.
Below roughly $5K ACV, this constraint makes PLG an economic necessity. That revenue is too low to pay back sales-led CAC of $5K–$50K. The choice of motion is therefore not simply a preference for self-service or salespeople.
CAC benchmarks by ARR stage and funding gate
Within those ACV constraints, investor expectations tighten as a company matures. Seed and Pre-Series A companies below $2M ARR can have LTV:CAC below 3:1 while validating product-market fit, with payback under 24 months. Early estimates need room to develop. The 3:1 benchmark becomes meaningful only after roughly 250 customers and six months of churn history, and VC-backed early-stage companies can accept lower ratios when they improve quarter over quarter.
The Series Seed+ or Pre-A bridge band at $1M–$10M ARR targets payback under 15 months and LTV:CAC of 3:1+, with retention improvements as the main driver. Series A companies at $2M–$10M ARR preferably repay CAC within 12 months. Their median LTV:CAC is 2.6x–3.1x, against 4.8x–5.2x in the top quartile. From Series A onward, investors expect companies to show how they can reach sub-18-month payback within four quarters.
Series B is the most consequential threshold to monitor. At $10M–$50M ARR, the middle 50% of observed companies have payback of 14–18 months, segmented by ACV, with LTV:CAC of 3.5x+ and blended CAC around $1,200. Payback beyond 18 months correlates with higher down-round risk. A result that was tolerable while finding product-market fit can become a financing problem at this gate.
Scale and Series C+ benchmarks above $10M ARR show median LTV:CAC of 4.2x, a top-quartile figure of 6.4x, and median payback at or under 11 months. These funding and ARR bands overlap. They describe stage expectations rather than a rigid progression based on revenue alone. The Rule of 40 adds context, since 22-month payback at a score of 55 reads differently from the same payback at 18. It does not replace the stage gate.
CAC benchmarks by GTM motion across PLG, hybrid, and sales-led businesses
PLG and self-serve businesses have median CAC around $702, while sales-led enterprise businesses have median CAC roughly $11,400. Sales and marketing spend is roughly 28% of revenue for PLG, compared with roughly 45% for sales-led businesses.
Across PLG models, free-to-paid conversion averages roughly 9%, while nearly 48.8% of opt-out trials convert, compared with 18.2% of opt-in trials. Sales-assisted hybrid businesses work with a different signal. Product-qualified leads convert at roughly 25–35%, so each closed deal takes less sales labor and payback on PQL-sourced pipeline can stay under 12 months.
Hybrid CAC ranges from $500–$20,000 depending on ACV, with sales and marketing spend roughly 45% of revenue on a blended basis. PQL economics make this the most capital-efficient motion for companies between $10M and $50M ARR. For sales-led enterprise businesses, payback takes 15–18 months. High ACV and low monthly churn can still support strong cohort-level LTV:CAC at that pace.
Paid search CAC averaged around $802 per customer in 2026, while customer referral has had the fastest payback in the past. Organic channels offset media cost, but AI search is putting pressure on their efficiency by eroding organic click volume. None of these channel differences resolves an ACV-to-motion mismatch. A sales-led model on a sub-$5K ACV product has a model problem.
CAC benchmarks by industry vertical and the risk of crossing categories
Costs differ by industry even when companies are at the same stage and use the same motion. Fintech SaaS has self-serve or PLG CAC around $1,450 at the SMB median, compared with $81–$274 for e-commerce SaaS. Fintech’s compliance reviews and multi-stakeholder buying committees help explain why its acquisition costs differ from a simpler SMB purchase.
For sales-led SMB–mid-market fintech, CAC runs $1,200–$3,000, while sales-led e-commerce sits at $500–$900. Both have enterprise figures of $11,400+. Cybersecurity has some of the highest costs across motions, with sales-led medians in the mid-five figures. Its acquisition process takes longer because it calls for long proof-of-concept stages and deep technical validation. An e-commerce SMB benchmark cannot meaningfully grade that process.
Other verticals converge where buying is simpler. HR Tech and Staffing, LegalTech, and MarTech each have SMB ranges of $150–$700, mid-market ranges of $1,200–$3,000, and enterprise ranges of $5,000–$15,000. For AgTech and Building IoT, SMB costs start at $500+, and the mid-market and enterprise bands are the same as those above. At low ACVs, buying simplicity can outweigh the product category.
Developer Tools have median industry payback of around 9.4 months, in part because technical proof-of-concept stages make payback take longer than it does for typical productivity tools. Education SaaS has the fastest payback among tracked verticals at around 3.8 months. HR and Recruiting has the slowest at around 10.6 months because of high CAC despite strong ARPU. A low SMB acquisition figure does not describe every segment within a vertical.
The expansion CAC gap and the limits of new-logo benchmarks
Acquiring a new customer and expanding an existing account have different economics. Expansion CAC runs around $1.00 per dollar of ARR, versus roughly $2.00 for new customers. That makes upsell and cross-sell the highest-leverage growth-stage motion on a capital-efficiency basis, rather than a secondary consideration after new-logo acquisition.
This changes how a blended ratio should be read. Above $50M ARR, over half of new ARR originates from existing customers, making blended payback non-comparable to new-logo figures without segmentation. Retention also changes what looks healthy. A 3:1 LTV:CAC with 12-month payback and 120% NRR is excellent, while the same ratio with 30-month payback and 95% NRR is structurally weak.
Stage-specific NRR guardrails help distinguish those cases. Seed has a floor of 97%, with a red flag below 85%. Growth and Series A–B companies should be at or above 106%, the all-B2B 2026 median, while the top quartile reaches 120–125%. Scale and Series C+ enterprise businesses have a threshold of at least 118%. LTV:CAC cannot substitute for these retention checks.
Confirm NRR is above 106% before spending more on paid new-logo acquisition. If gross retention is below 85%, retention is the binding constraint, and acquisition optimization cannot rescue the ratio. Fast growth can be a reason to spend more than average on acquisition. That case depends on NRR being high enough for expansion to compound the investment.
Applying the framework to your own CAC
First, confirm that CAC includes salaries, tools, agency fees, and onboarding costs, and that both LTV and payback use gross-margin-adjusted revenue. Next, locate the ACV tier and its spending and payback limits. This establishes structural viability before a peer comparison offers reassurance.
Then identify the ARR stage and its investor threshold. The relevant test is the funding gate, with a 3:1 floor applicable only where the stage’s investor threshold calls for it. Apply the GTM filter within that stage, followed by the vertical filter. Sales-led payback of 15–18 months is at the motion’s median, while the same result for a PLG product signals a channel problem. Selling software does not by itself make Cybersecurity a useful benchmark for HR tech.
Finally, test LTV:CAC against the stage’s NRR floor. If NRR falls below it, put more weight on payback and wait for retention to improve before trusting the ratio. Break out channel-level LTV:CAC as well, because blending organic and paid CAC makes paid acquisition appear cheaper than it is. Board materials should present CAC payback, LTV:CAC, Rule of 40, and NRR together.