Data-Driven Marketing Strategy for Mid-Market B2B Teams
How mid-market B2B teams build data strategies for 121-day sales cycles.
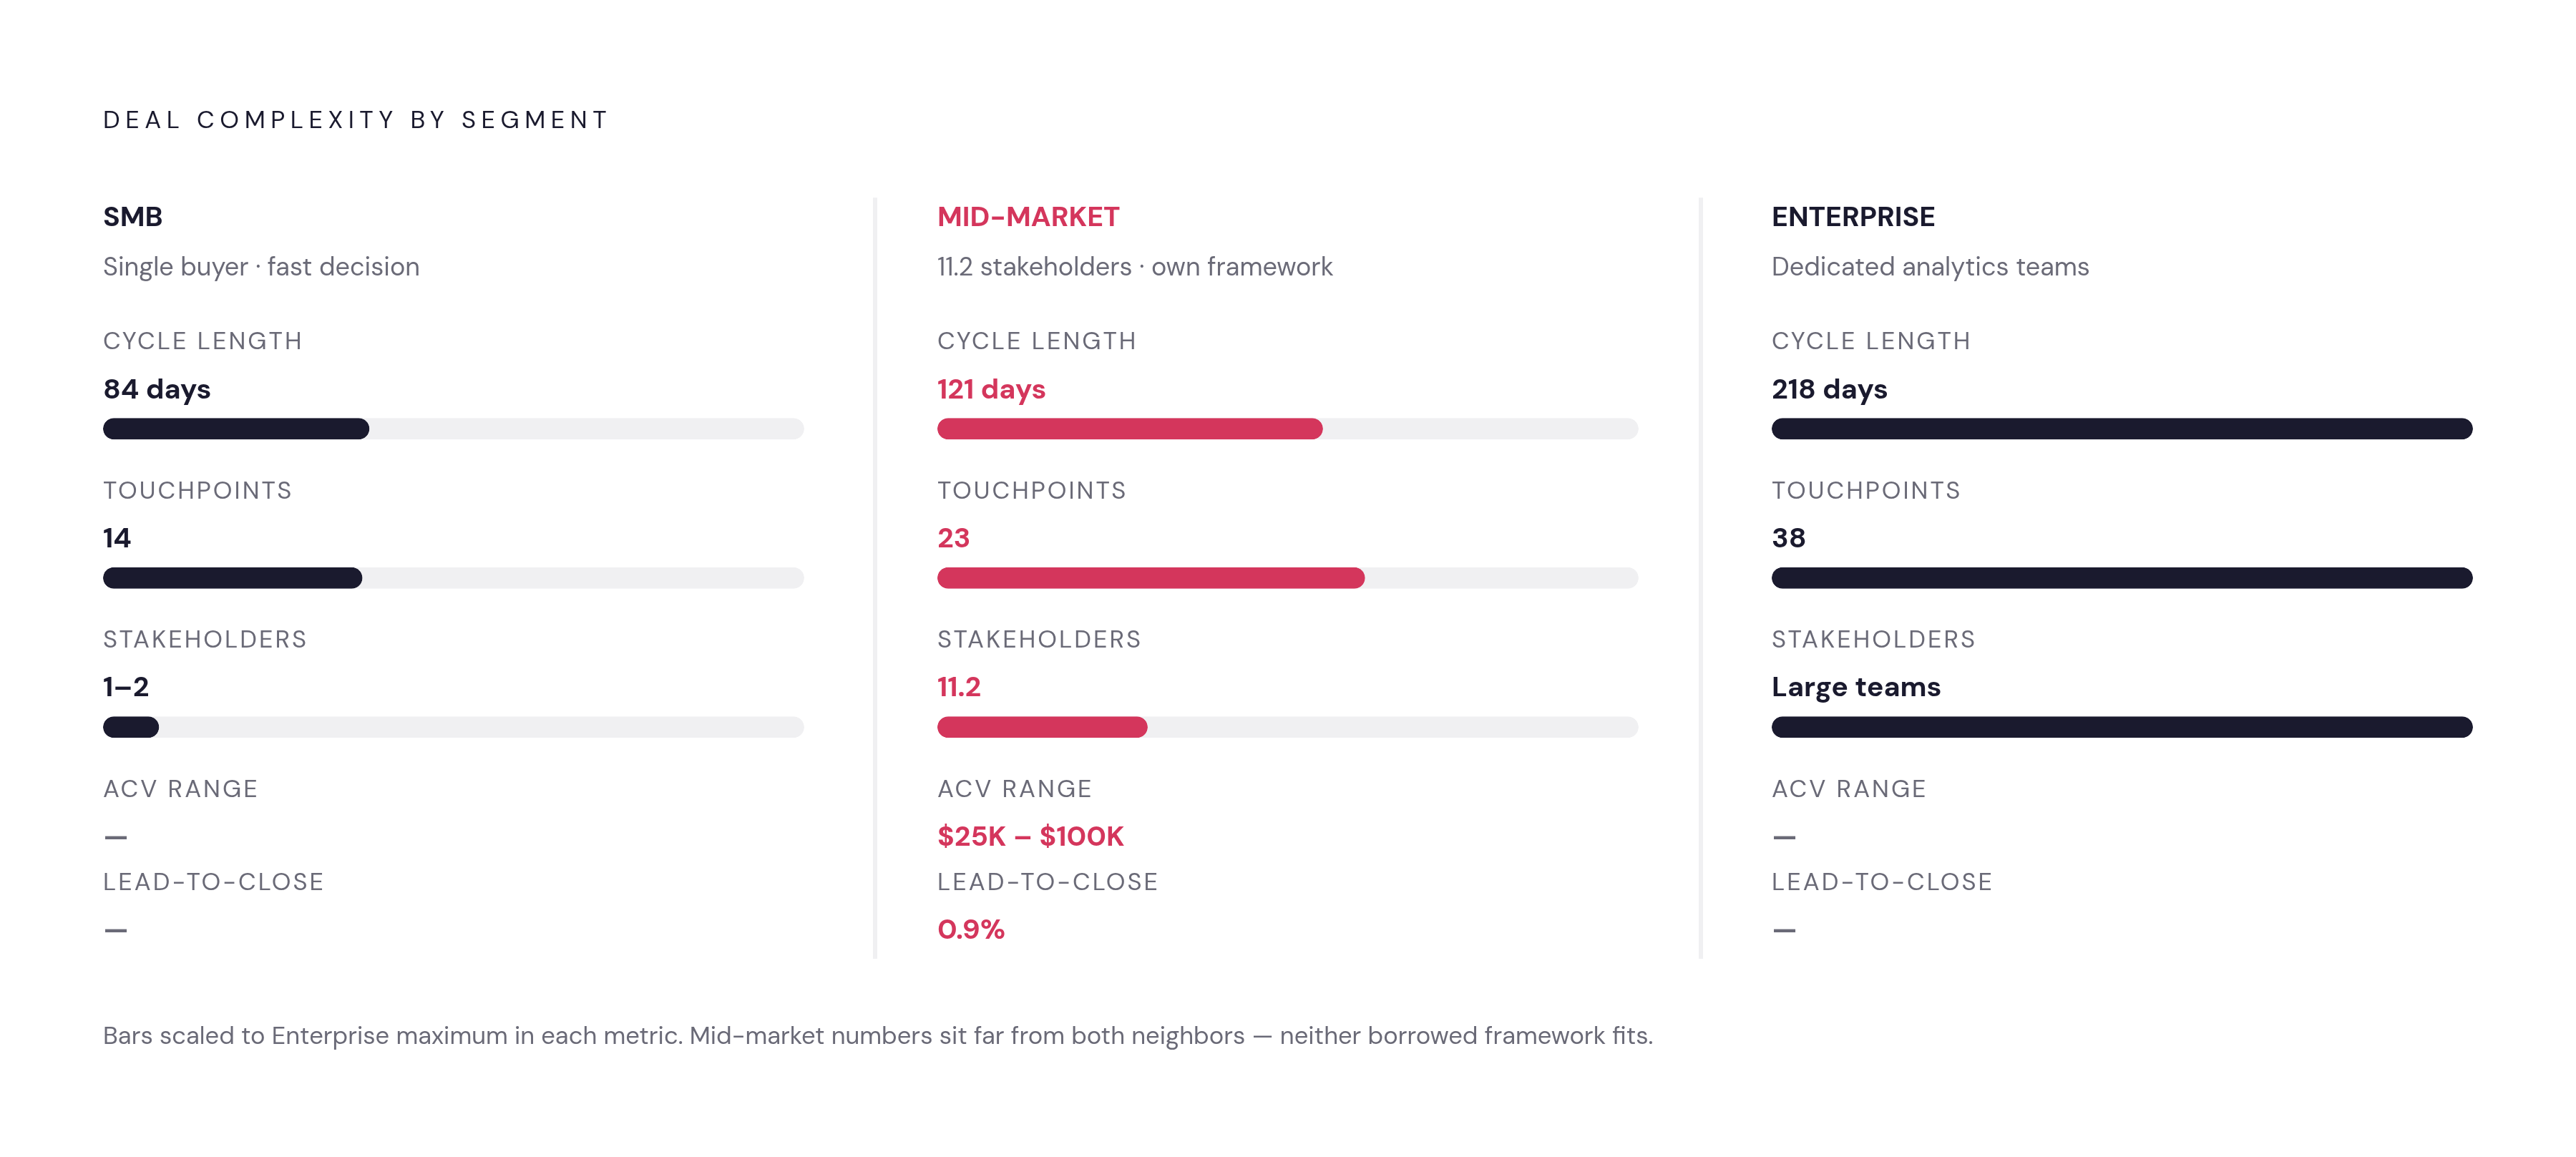
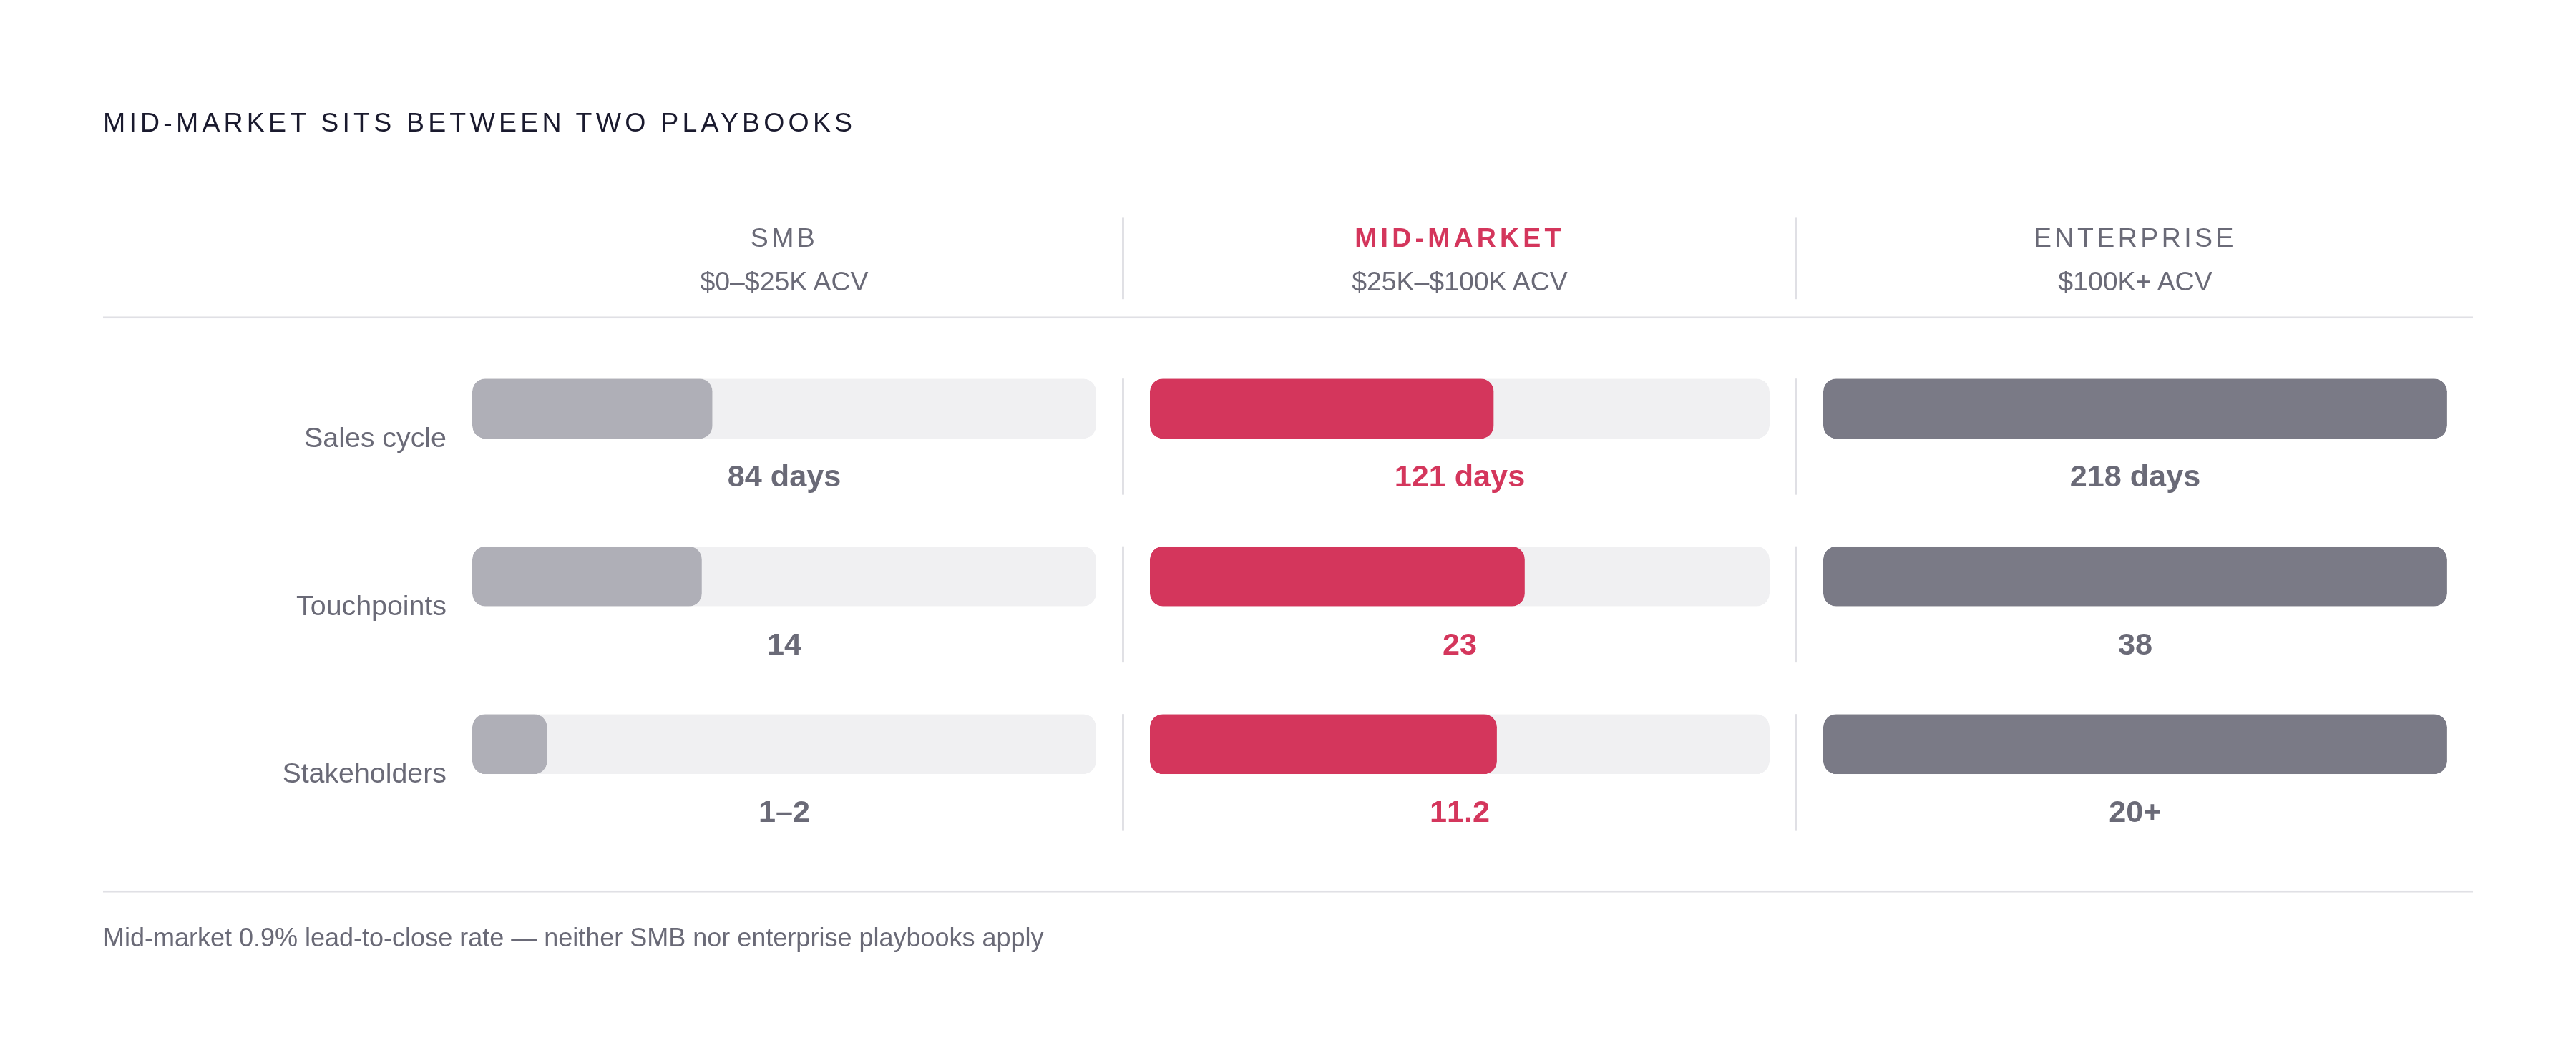
Mid-market B2B marketing runs on its own clock. The sales cycle averages 121 days, buyers touch your brand 23 times before signing anything, and the buying committee has swelled to 11.2 stakeholders on average, up from the prior year according to Forrester and 6sense. This piece is about how a mid-market team uses data across that stretch without pretending it has enterprise infrastructure sitting in a closet somewhere, and without borrowing SMB shortcuts built for deals that move at a different speed entirely.
Look at the band we're actually working in. SMB deals close in roughly 84 days across 14 touchpoints; enterprise stretches to 218 days and 38 touchpoints. Mid-market sits at $25K to $100K ACV, closing at a 0.9% lead-to-close rate over those 121 days. Those numbers aren't trivia for a slide, they're the decision architecture a marketing team has to build around, because you're tracking influence across eleven-plus people over four months and "what do we collect, and when do we act on it" needs an answer built for this specific middle ground. Enterprise playbooks assume a dedicated analytics team and ABM infrastructure most mid-market shops have never had funded. SMB playbooks assume one buyer and one fast decision. Mid-market gets neither luxury, which is exactly why it needs its own framework instead of a shrunk-down enterprise deck.
What buyers are actually doing across those 121 days before sales gets involved
Forrester puts buyers at roughly 80% through their purchase process before they ever talk to a sales rep. Do the math on a 121-day cycle and that's about 97 days where your prospect is doing something, somewhere, and you have no window into any of it.
It's also not one person doing one thing. Several people on the committee are running entirely different jobs, often without telling each other. The champion is building an internal case, hunting for proof points ahead of a Tuesday leadership meeting. The economic buyer is running ROI math against a budget nobody bothered to mention to marketing. The technical evaluator is buried in integration docs, checking whether this thing will actually talk to whatever's already running in production. They rarely coordinate with each other, and they almost never loop you in.
That's a visibility problem first-party data can't solve alone. Site visits, content downloads, webinar attendance, these show a slice of committee activity, but only the slice that happens to touch channels you own. If the technical evaluator is reading a G2 comparison thread or some Reddit post about your category instead of your product pages, your CRM has nothing to say about it. Not a single row.
When this piece says "23 touchpoints," it doesn't mean 23 steps on a tidy staircase toward a signature. It means a scattered, overlapping mess of interactions across multiple roles, most of it happening before you even know the deal exists. That's the argument for layering intent data on top of first-party signals instead of picking one and hoping (more on the mechanics of that a few sections down). For now, 97 of your 121 days are a black box, and the job is building enough of a flashlight to see a few feet into it.
The resource constraint that makes most data strategies fail before they start
Here's an uncomfortable stat to sit with for a second: in the 2025 CMO Survey, 51.8% of senior marketing leaders named "using data and analytics to tackle our most important problems" as their second-biggest challenge of the year. Basically a coin flip among your peers.
Heinz Marketing found that nearly 90% of B2B teams report attribution problems stemming from fragmented data and siloed systems. That's not a special category of dysfunction reserved for your team specifically. It's the default condition of the entire industry, and misery apparently does love company.
Mid-market feels this acutely because it lacks the internal muscle enterprise takes for granted. There's no dedicated data science function, and no marketing ops team whose entire job is stitching platforms together so the CRM and the ad platform can agree on basic facts like how many leads actually came from that campaign. CRM, marketing automation, and ad platforms sit as separate islands, each insisting its version of the truth is the correct one. And the money to fix any of it is thin: B2B marketing budgets average around 7.7% of revenue in 2025 (Forrester puts B2B slightly higher, at 8.4%), and 59% of CMOs told Gartner's 2025 CMO Spend Survey they don't have enough budget to run the strategy they already committed to on paper.
Pouring resources into data collection without the infrastructure to act on it just produces dashboards. Pretty ones, sometimes, color-coded funnels that look terrific in a board deck and mean nothing operationally, because nobody's logging in on a Tuesday to change a bid strategy because of them. The framework here has to be selective by design: a short list of signals tied to specific decisions, not comprehensive instrumentation for its own sake. If you came looking for a system that tracks everything, this isn't it, and nobody at your revenue size should be building that system anyway.
How to allocate a mid-market marketing budget when data is telling you to do two things at once
The core tension here is almost comic in its simplicity. You need brand presence to stay visible during those 97 days of self-directed research, and you need demand capture ready the second a buyer actually raises a hand. Your data will tell you to do both, at once, with a budget that was already tight before you asked it to moonlight on a second job.
LinkedIn Marketing Solutions offers a useful reference point: a 60/40 split, the majority toward brand-building that primes future demand, a substantial minority toward direct response aimed at buyers already in-market. That ratio ties to durable growth over time, and it matters for mid-market specifically because it pushes back against the constant pull toward next quarter's pipeline number. Everyone wants next quarter to look good. Fewer people are willing to defend the brand spend that makes next year possible, mostly because it never shows up as cleanly on a dashboard as a lead count does.
Context helps too. Companies under $5M ARR allocate a median of 14% of revenue to marketing, per Benchmarkit; cross above $150M ARR and that median drops to roughly 4%. Mid-market lives somewhere in the middle of that curve, with real ceilings on total spend that neither extreme has to think about the same way. Within that constrained budget, demand generation usually claims the largest single slice, rising to 34-38% of program budget once a company crosses $5M in ARR. The sharper question isn't whether to reshuffle the whole pie, but how to optimize inside the slice you've already got.
Let pipeline velocity and stage conversion decide where that 40% demand budget concentrates, rather than channel habit or whatever worked at the last company someone on your team came from. And here's a fact worth repeating to any finance partner skeptical of marketing spend: marketers who calculate ROI are 1.6 times more likely to get a budget increase. Measurement isn't a reporting exercise you run after the fact. It's a budget strategy in its own right.
Which channels actually earn their place in a mid-market funnel built for 23 touchpoints
This isn't a channel ranking exercise, so if you came for a top-five list with a trophy at the end, wrong article. The real question is which channels generate the right touchpoint at the right stage, for a deal that eleven different people are quietly, separately deliberating over.
Email remains the workhorse of the nurture layer, and for good reason: ROI running $36 to $45 per dollar spent, with 50% of US B2B marketers calling it their single most impactful multichannel component, per eMarketer. It suits a multi-stakeholder deal because you can address it by role: one sequence for the champion building an internal case, another for the economic buyer crunching numbers, a third for the technical evaluator checking integration boxes. One caveat worth flagging: the 43.5% average B2B open rate reported for 2025 is inflated by Apple's Mail Privacy Protection, which opens emails in the background whether a human ever looked at them or not. Click-to-open rate, sitting around 6.8%, is the more honest read on actual engagement.
SEO does something no other channel does quite as well: it shows up during that 80% of the buying journey that happens before anyone talks to sales. Reported ROI of 748% makes it the highest-returning channel in this set, and content built to answer committee-level questions, not just the decision-maker's questions, keeps compounding across all 121 days instead of expiring after a single campaign flight.
LinkedIn Ads earns its place as the paid channel best aligned with account-based motions, since firmographic targeting lets you reach specific roles inside specific target accounts, which matters when your committee has eleven seats to fill. The differentiator is a higher MQL-to-SQL conversion rate compared to search-based paid channels. The leads coming through are better qualified, not more numerous, and that distinction matters more than most media plans give it credit for.
Webinars and video round out the mid-funnel. Webinars post 213% ROI, and short-form video drives the highest ROI among video formats for 41% of B2B marketers, according to LinkedIn's 2025 B2B Marketing Benchmark. Both generate genuinely useful first-party data: who showed up, how long they stayed, what they clicked afterward. That's fuel for your attribution model, not an awareness exercise you run because a competitor ran one last month and it looked fine.
Pick channels based on where the data shows engagement actually dropping off across the 121 days. Skip the fashionable option this quarter, and skip whatever a vendor's rep is pitching you over lunch.
Using intent data to find the 28 days inside the 121-day cycle where you can actually accelerate
Somewhere inside that 121-day cycle sits a window where the deal genuinely wants to move faster. Intent data is how you find it. Bombora's 2024 Company Surge Performance Report found intent-prioritized accounts convert to closed opportunity at more than double the rate of non-prioritized accounts. That's the gap between a campaign that pays for itself and one that just sort of exists in a budget line.
The trick is blending sources, not picking a side. Third-party topic signals combined with first-party engagement data improve MQL-to-SQL conversion by 34% compared to third-party signals alone. Neither source tells the whole story by itself. Together, they start to, and intent-flagged accounts compress their path to closed opportunity by roughly 28 days versus baseline, which is a genuinely useful lever for a team that can't just hire six more SDRs to hit the same number this year.
What does acting on that signal look like on an actual Tuesday afternoon? An intent spike on a target account should trigger something coordinated, not sequential: an email sequence to known contacts, a LinkedIn ad campaign targeted to the account's domain, and SDR outreach, all firing in the same window instead of queuing up one after another. Pipeline velocity moves more when all three respond to the same signal together than when any one channel tries to carry the moment alone.
First-party data is the foundation underneath all of this, and Gartner reports a large majority of B2B marketers are already shifting toward first-party strategies as third-party signals grow less reliable. Mid-market teams building this muscle now are setting up an edge that compounds later. One honest constraint though: first-party data needs volume to mean anything, and a small target account list won't generate enough signal density on its own to be useful. That's exactly why the third-party layer still matters, especially for teams whose ICP list runs into the hundreds rather than the thousands.
Where ABM fits in a mid-market motion, and what "mature ABM" actually requires
ABM stopped being a campaign type a while back. Forrester's 2025 ABM benchmark puts the vast majority of B2B marketing teams running some form of ABM program, which makes it less a strategic choice at this point and more the default operating structure of the industry.
Here's the less flattering half of that number: a small minority of teams have ABM fully embedded into how the business runs day to day, and only about a third consider their strategy fully optimized. Most teams have the label taped to the door without the operating model behind it. Nearly nine in ten teams are "doing ABM," yet plenty would admit, off the record, that it's mostly an account list and a slightly nicer-looking ad campaign.
Resource reality shapes how mid-market handles this. With 48% of B2B marketing leaders citing budget, headcount, or resource cuts as their top challenge, most mid-market teams land on what's sometimes called "ABM Lite," trading one-to-one enterprise personalization for something more scalable. Structurally that means account selection driven by ICP fit plus intent signals instead of firmographic filters alone, and personalization pitched at the segment level (industry vertical, buying stage, persona) rather than custom assets built account by account. Maybe most important: sales and marketing share one account list and one set of engagement data, instead of working off separate spreadsheets that quietly drift apart over a few months until nobody trusts either one.
The maturity gap traces to one root cause. Teams that treat ABM as a stack of campaigns rather than a strategic operating model tend to get mediocre results no matter how much effort they pour in. Data infrastructure and cross-functional coordination between sales and marketing separate the mature quarter from the mediocre one, not ad spend. And the payoff for getting it right is real: mature ABM programs generate meaningfully more pipeline per marketing dollar than broad-reach demand gen, with higher win rates and bigger deals to show for it. You still have to build the foundation instead of buying a list and calling it a strategy.
Attribution across 23 touchpoints and 11 stakeholders: what mid-market teams can actually measure
Nearly 90% of B2B teams report attribution problems tied to fragmented data and siloed systems. That's the floor everyone's standing on, not some embarrassing outlier situation unique to your particularly messy CRM.
Standard attribution models weren't built for a 23-touchpoint journey, and it shows. First-touch rewards whatever ad or search result happened to start things off. Last-touch rewards whatever happened right before close. Neither captures the sustained nurture that actually built the relationship over four months. Linear attribution tries to be fairer by spreading credit evenly across every touchpoint, but that ignores the outsized role certain moments play, like the one webinar that finally pulled a silent economic buyer back into the evaluation after three weeks of nothing.
So what can a mid-market team, without an in-house data science department, actually measure? Account-level pipeline attribution is a solid starting point: track which accounts touched which channels before advancing to opportunity, rather than tracing individual contact paths, which turns into a tangle fast once eleven people are involved per deal. Cohort analysis by ICP segment helps too, comparing conversion rates and cycle length for accounts that got a specific content sequence or channel combination against those that didn't. Stage velocity, meaning how long accounts sit in each funnel stage and where they get stuck, tends to be a far more actionable signal than trying to reverse-engineer which single touchpoint "caused" the sale.
There's a compounding case for building this out even imperfectly. 64% of companies already base budgets on past performance, and, as mentioned earlier, marketers who calculate ROI are 1.6 times more likely to see their budget grow. Gartner also found 54% of companies making heavy use of marketing analytics report above-average profits. Nobody has a perfect attribution model here. The gap between the teams pulling ahead and the teams standing still comes down to consistent use of whatever data they've actually got, not the sophistication of the model itself.
Building the data foundation that makes each stage of the funnel improvable over time
Better data leads to better allocation, which leads to better returns, but only if the underlying infrastructure stays consistent enough to compare one period or segment against another. Change your measurement method every quarter and you've got noise, not a trend line worth acting on.
Three layers are worth building first. First-party engagement capture means instrumenting every content asset, webinar, and email sequence so you can see account-level engagement, not just which individual clicked what link. Second, the CRM needs to actually function as the system of record for account status: pipeline stage, stakeholder mapping, and touchpoint history all living in one place that sales and marketing can both read, without translating between two tools that were never built to talk to each other. Third, an intent data feed, ideally third-party signals supplemented with your own first-party data, gives you visibility into accounts doing active research before they ever show up in your CRM at all.
AI tooling has a real place in this stack, though it's worth being specific about where. It works as the execution layer that makes personalization at scale possible without hiring a much bigger team, sitting alongside the strategic decisions this piece has walked through rather than replacing them. Think AI-assisted content production that adapts messaging by persona and buying stage, informed directly by the engagement data your stack is already collecting, instead of generic content churned out on a schedule and hoped for the best.
The payoff shows up in the numbers: marketers who've embedded AI and data into their strategy report, on average, 13% higher revenue. That edge compounds, and it goes to the teams willing to build the foundation instead of chasing whatever dashboard looks impressive this quarter.