Marketing Funnel Stages in a Computational Marketing Model
Most companies measure funnels by feel instead of fixing the math that drives conversions.

I've spent enough years staring at CRM exports to tell you the marketing funnel isn't a metaphor. It's a math problem, and most companies never sit down to actually solve it. A computational model treats each stage as a measurable state: an entry condition, an exit rate, a scoring rule that decides when a record graduates from one bucket to the next. About 68% of companies haven't identified or measured their funnel at all, per b2bmarketingworld.com, which means they're running a model with zero instrumentation and calling the output "strategy." I want to walk through what actually happens when you put math underneath the boxes and arrows, and where the math still doesn't hold up.
How the funnel's stages are formally structured before any math is applied
The classic version splits into three bands: top for awareness, middle for consideration, bottom for decision. Simple enough to sketch on a napkin. That's more or less why it's lasted fifty years in marketing textbooks with barely a scratch on it.
Three buckets is a coarse instrument for something as messy as human buying behavior. So extended models showed up to add resolution. A five-stage version inserts intent as its own state between consideration and conversion, then tacks loyalty on the end. The hourglass model goes further and treats what happens after the sale, adoption and retention, as real stages with their own entry criteria. Dave McClure's Pirate Metrics, AAARRR (awareness, acquisition, activation, retention, revenue, referral), shows up constantly in product-led and SaaS contexts. It was built with software in mind, not billboards.
B2B teams translate all this into a pipeline of named lead types: Visitor, Lead, MQL, SQL, Opportunity, Closed-Won. Each label maps to a defined entry condition, at least on paper. A lead becomes an MQL because it crossed a threshold someone wrote down in advance, not because a sales rep had a hunch on a Tuesday. A stage without a written threshold leaves the label meaningless, and I've sat in enough pipeline reviews to watch that exact argument happen in real time.
Buyers don't move through any of this in a straight line, and that's the real headache. They loop back, go dark for six weeks, then re-enter research mode after they've already talked to sales. A model has to handle re-entry, not just forward flow, or it ends up describing a customer who only exists in the slide deck. There's a newer wrinkle, too. AI search tools compress discovery, evaluation, and comparison into one sitting; someone goes from "what is this category" to "which vendor should I pick" in a single conversation. Every stage-boundary model above assumes time passes between stages. What happens when it doesn't? I don't think anyone's answered that cleanly yet, and I'd be suspicious of anyone who claims they have.
The conversion rates that define each stage boundary
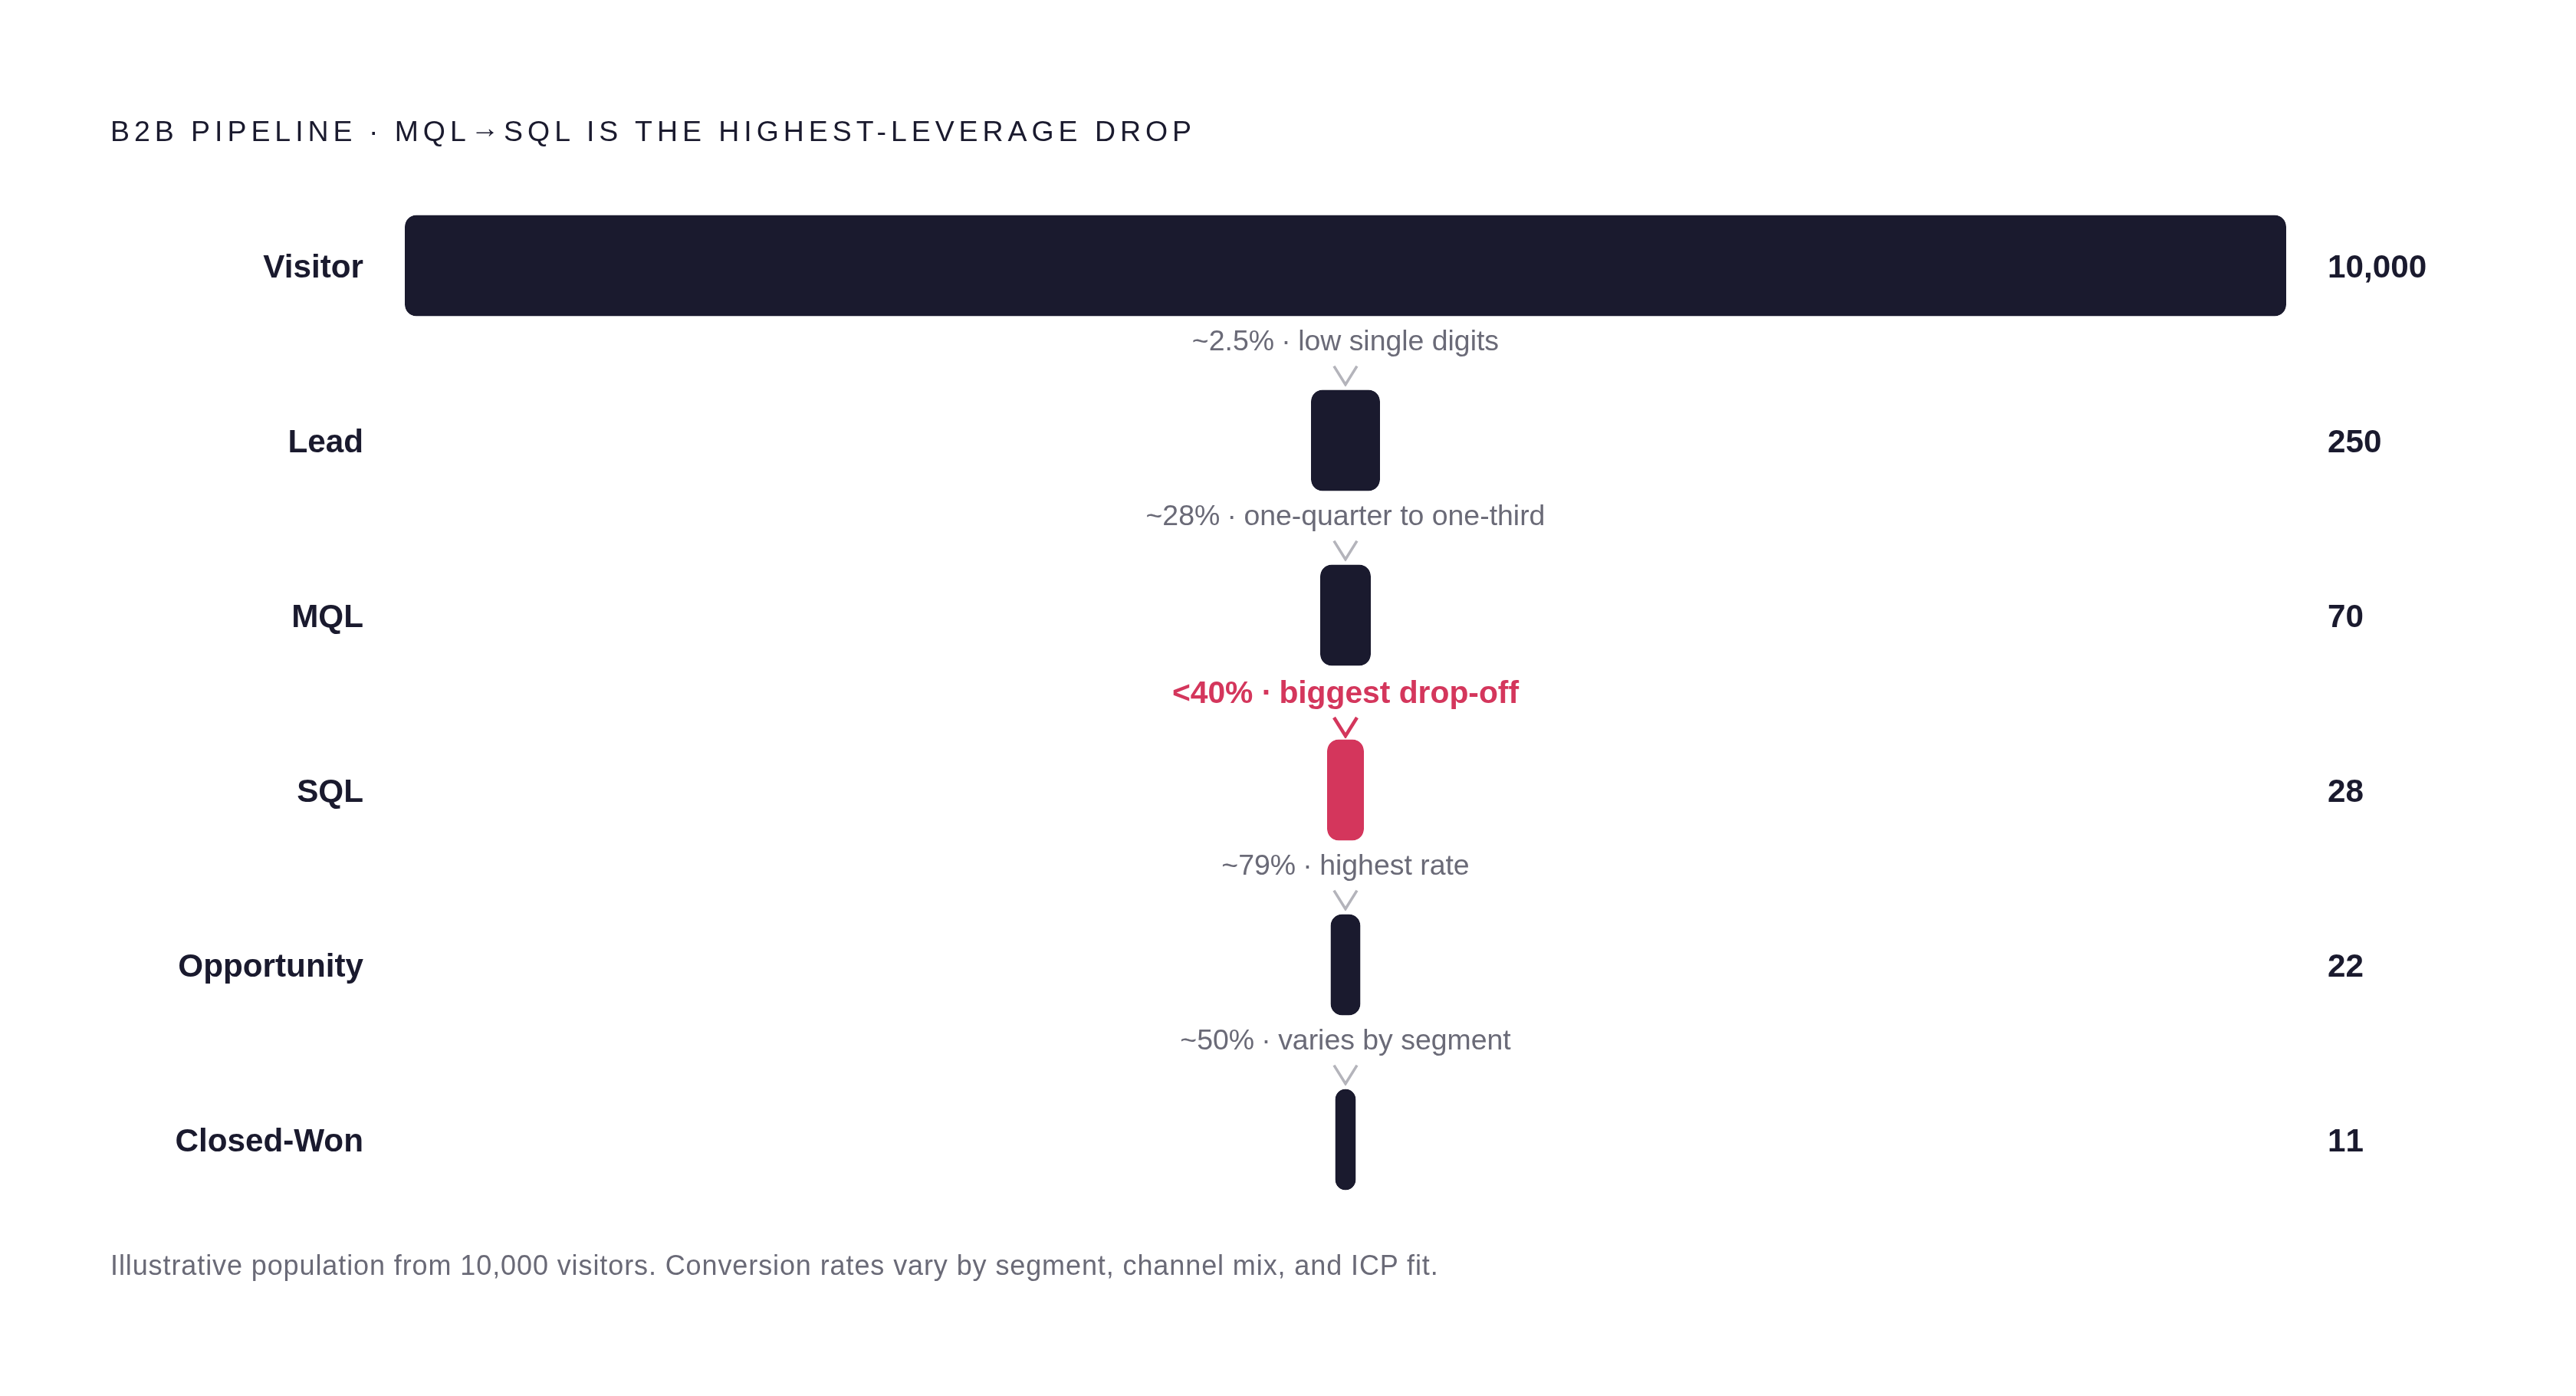
Start with the ugly number: 79% of acquired leads never convert to sales, a widely cited figure tracked by b2bmarketingworld.com. Most of the funnel evaporates somewhere between "gave us an email" and "gave us money." An uninstrumented funnel absorbs that loss as a cost of doing business. An instrumented one asks where, exactly, it happened, then goes looking for the leak.
For orientation, the all-industry average landing page conversion rate sits around 2.35%. Top-quartile pages hit 5.31% or better, and the best performers reach 11.45%, roughly a fivefold spread between average and excellent (b2bmarketingworld.com's numbers, if you want to check my math). That spread is the whole argument for treating conversion rate as a variable you go change, rather than a fixed number handed down by industry gravity.
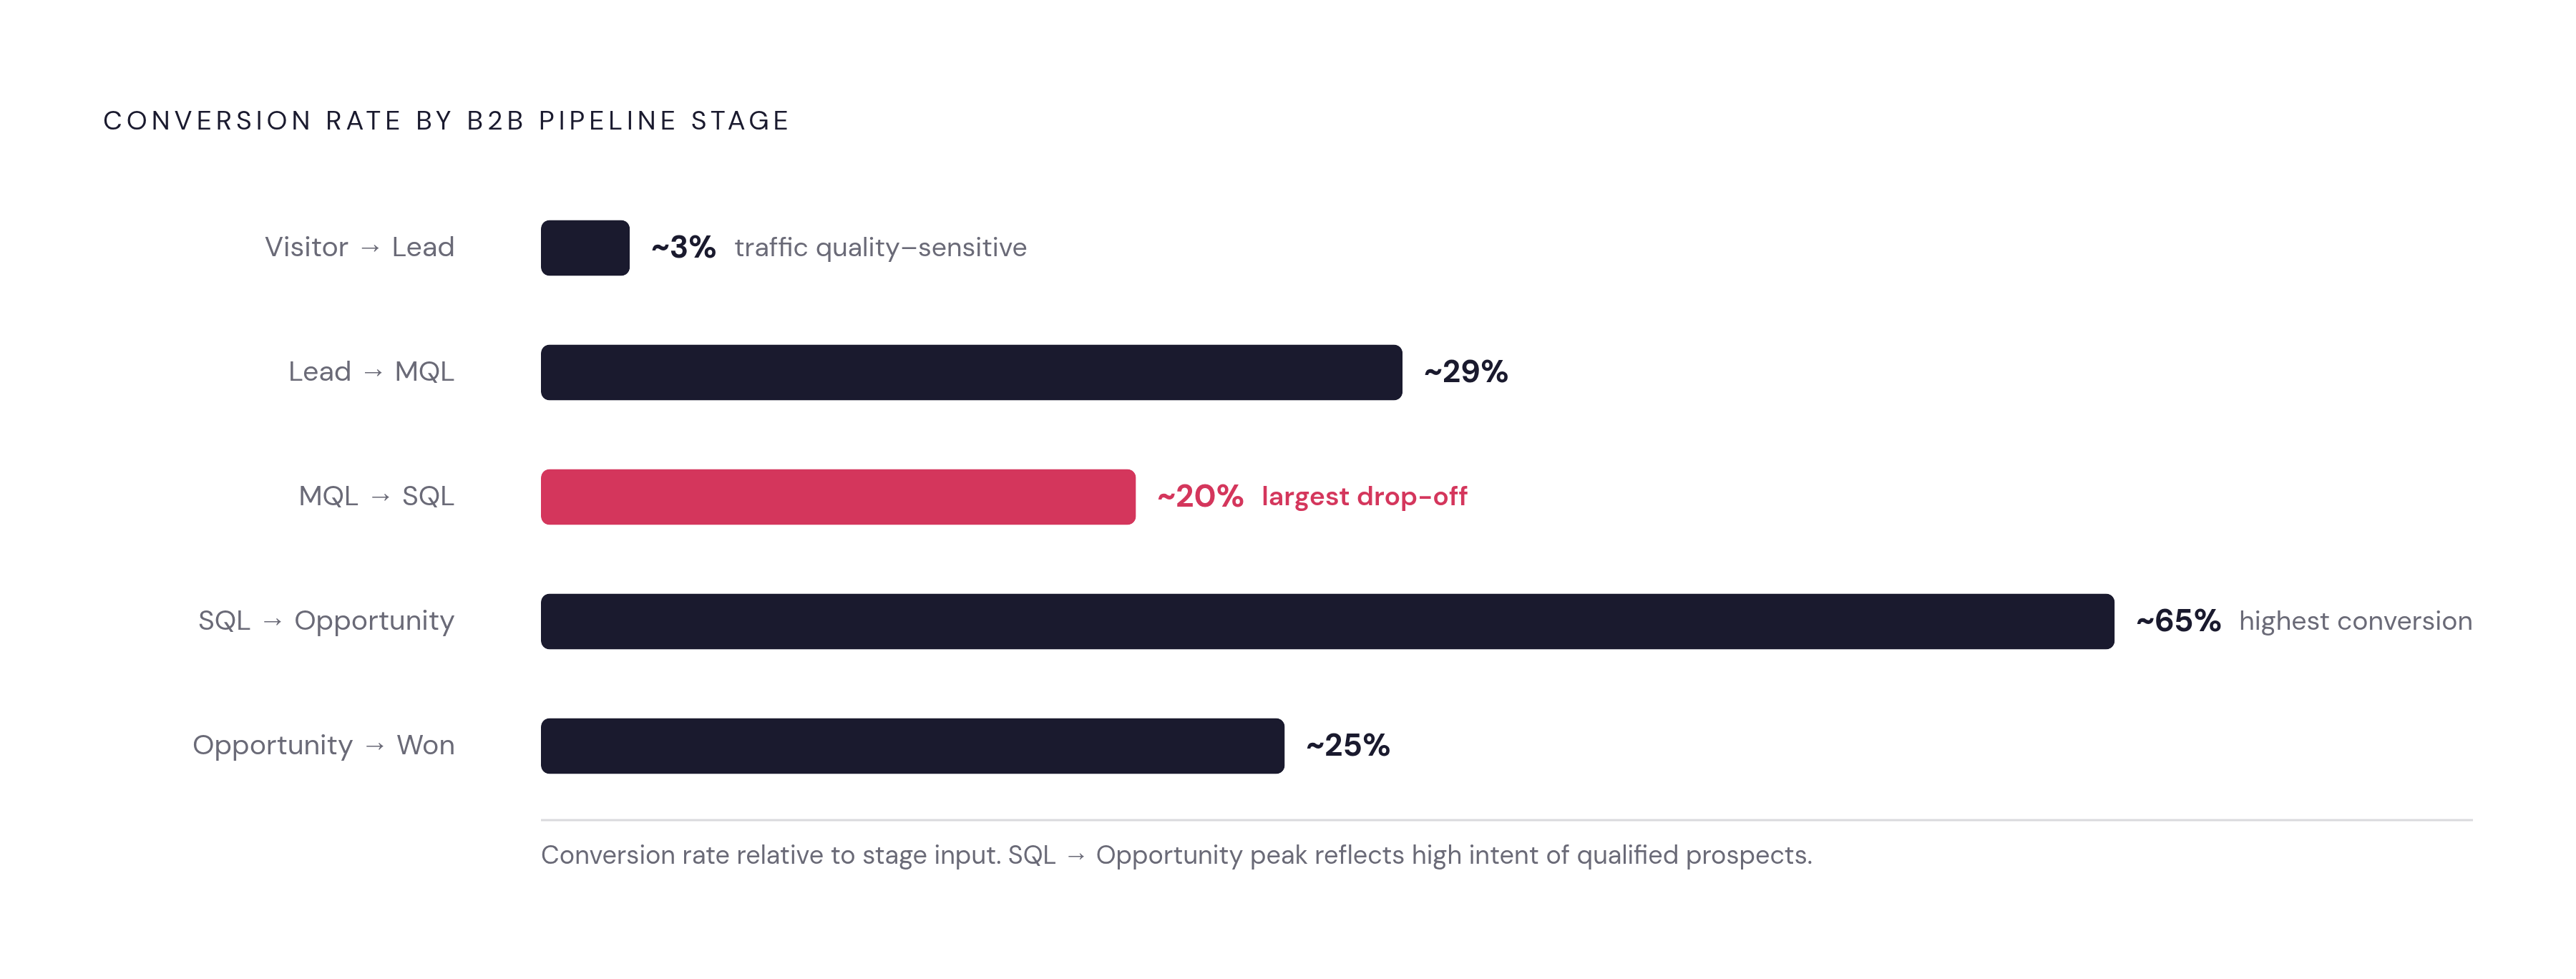
Inside the B2B pipeline, VWO's 2026 benchmark data breaks the rates down stage by stage, and the pattern teaches you something. Visitor to Lead sits in the low single digits and is brutally sensitive to traffic quality; garbage traffic produces garbage conversion no matter how good your form is. Lead to MQL clears roughly a quarter to a third of leads, already a meaningful filter. MQL to SQL is the tightest handoff in the pipeline, with typically fewer than half of MQLs getting validated by sales. Then, oddly, things improve: SQL to Opportunity is the highest conversion point in the entire pipeline. Opportunity to Closed-Won varies wildly by segment and comes down to deal value and how well sales executes on a given week.
Sit with the MQL to SQL number, because it's the one that actually matters. It's consistently the biggest drop-off point in B2B funnels, which makes it the highest-leverage transition to instrument. I've watched teams spend six months polishing a checkout flow that was never the actual problem, while the real leak sat one stage upstream the whole time, quietly draining the pipeline nobody was watching. Fix that transition and the rest barely needs touching.
Sector variation matters too, and a single blended number will mislead you every time you use it for calibration. Legal services and SaaS sit at opposite ends of the B2B conversion range; e-commerce beauty and health products convert nothing like the rest of e-commerce. A median landing page conversion rate of 6.6% across industries is a decent reference point for BOFU benchmarking. Treat it as a starting line, calibrated for your specific business, since a blended average rarely is.
How lead scoring encodes stage transitions as decision rules
Lead scoring is where "readiness" turns into arithmetic: downloading a TOFU guide is worth a little, attending a webinar is worth more, visiting the pricing page is worth more still, and requesting a demo is worth the most. Cross a defined threshold and the record moves, automatically, from TOFU nurture into MOFU sequences; cross a higher one and it moves into BOFU outreach.
What this buys you, computationally, is a testable rule. Before scoring existed, "is this lead ready for sales" was a standing argument between marketing and sales that usually ended with marketing insisting the lead was hot and sales insisting it was ice cold. With a threshold, you audit the disagreement instead of just having it again next Tuesday: either the threshold's wrong, or the inputs feeding it are wrong. Either way, you've got numbers to argue about instead of feelings.
Here's the timing problem nobody likes bringing up at the quarterly review. The average B2B sales cycle runs for weeks, and roughly half of leads are qualified but not yet ready to buy, per b2bmarketingworld.com data on the subject. That's a lot of pipeline sitting in limbo. If your scoring model treats crossing a threshold as a one-time gate instead of something tuned to nurture cadence, you'll hand sales a pile of leads that are technically "MQL" and functionally unresponsive to a phone call. Fit tells you if someone belongs in the funnel. Latency tells you when to actually bother them. A model needs both, or it's only half built.
Nurture sequences move scores upward over time instead of relying on one big splashy conversion moment. Content does more work here than people credit it for: 55% of businesses report articles and blog posts as their single most productive way to move potential customers down the funnel, according to b2bmarketingworld.com data. Nurture emails also beat general sends on click-through rate by a meaningful margin, a signal the scoring engine can treat as real instead of noise.
One thing most scoring models get wrong, or skip outright, is decay. A score should drop when engagement goes cold. Somebody who downloaded three whitepapers in March and vanished isn't still a 90-point lead in September, no matter what the dashboard insists. Most systems only add points and never subtract, so dead leads sit at the top of everyone's priority list indefinitely.
Stage-specific inputs, content types, and KPIs across TOFU, MOFU, and BOFU
TOFU runs on SEO content, social ads, influencer partnerships, and blog posts, with KPIs like unique reach, click-through rate, and new visitor volume. Content marketing earns its keep here because it drives reach at a lower cost than paid acquisition, which matters when your budget isn't the size of a national ad buy. The job at this stage is volume estimation and channel efficiency: which sources actually fill the top of the pipe, and at what cost per entrant?
MOFU shifts to email nurture, retargeting, webinars, and case studies, with KPIs like page views, branded search volume, engagement depth, and score progression. The job here is velocity tracking: how fast leads move, and where exactly they stall out. One number worth keeping in your back pocket: the reported average is 21 outreach attempts per contact. That's not a typo, and it's a useful budget line for the model, since it tells you how many touches to plan before writing a lead off as unreachable.
BOFU is personalized offers, live chat, demo sequences, and a checkout process built to remove friction rather than add it. KPIs shift to conversion rate, customer acquisition cost, and return on ad spend. This is also where technical details stop being IT's problem and become marketing's problem. Cart abandonment has topped a significant majority in recent years per industry data, and recovery emails sent within 24 hours claw back a meaningful chunk of that lost revenue. Page speed matters more than most marketers want to admit, too: pages loading within one second convert at 2.5 times the rate of pages that take five, according to b2bmarketingworld.com data. Harvard Business Review backs the intuitive point that companies simplifying the buying process close more high-quality sales.
Content strategy has to map to these stages by intent, not just format. Awareness content that tries to hard-sell a demo mid-blog-post confuses the scoring model; it's asking a TOFU visitor to behave like a BOFU one. BOFU content that stays generic does the reverse damage. Either way, mismatched content generates noise the scoring engine has to sort through, and noise costs money.
Why retention and advocacy belong inside the model, not after it
The old funnel treats Closed-Won like a finish line. A computational model treats it as an input state feeding the next stage, and the economics make that treatment obvious once you actually run the numbers instead of taking the org chart's word for it.
Retaining a customer costs a lot less than acquiring a new one, and the odds of selling to an existing customer run about 14 times higher than selling to a stranger, per b2bmarketingworld.com data. A 5% increase in loyal customers can lift profits by at least 25%, a figure that shows up in roughly every retention deck ever built. Companies that align sales and marketing around a shared funnel report 36% higher customer retention. None of that shows up in your numbers if the model stops measuring the moment the invoice clears, which is a strange place to stop counting, honestly.
Post-funnel stages need their own KPIs, built into the model the same way TOFU and BOFU are. Retention gets churn rate, Net Revenue Retention, and customer health scores. Advocacy gets referral volume, program participation, and review count. The lifetime value gap between the two isn't small: customers who reach the Referral stage carry 3 to 5 times the lifetime value of customers who stall out at plain Retention. That gap is the whole case for optimizing toward advocacy, since "they didn't cancel" is a weak finish line all over again.
Emotional engagement turns out to be a quantifiable variable, worth measuring rather than filing away as a soft brand concept for the marketing deck. Customers who feel emotionally connected to a brand show 306% higher lifetime value and are 81% more likely to advocate on social media, per b2bmarketingworld.com data, and you track this through NPS, review cadence, and referral enrollment. Meta released LTVision, an open-source Python library, in January 2025, and Amazon rolled out Conversion Path Reporting the same month. Post-purchase modeling is becoming standard instrumentation now, available well beyond companies with a large data science department.
Attribution modeling as the credit-assignment layer that makes the full funnel legible
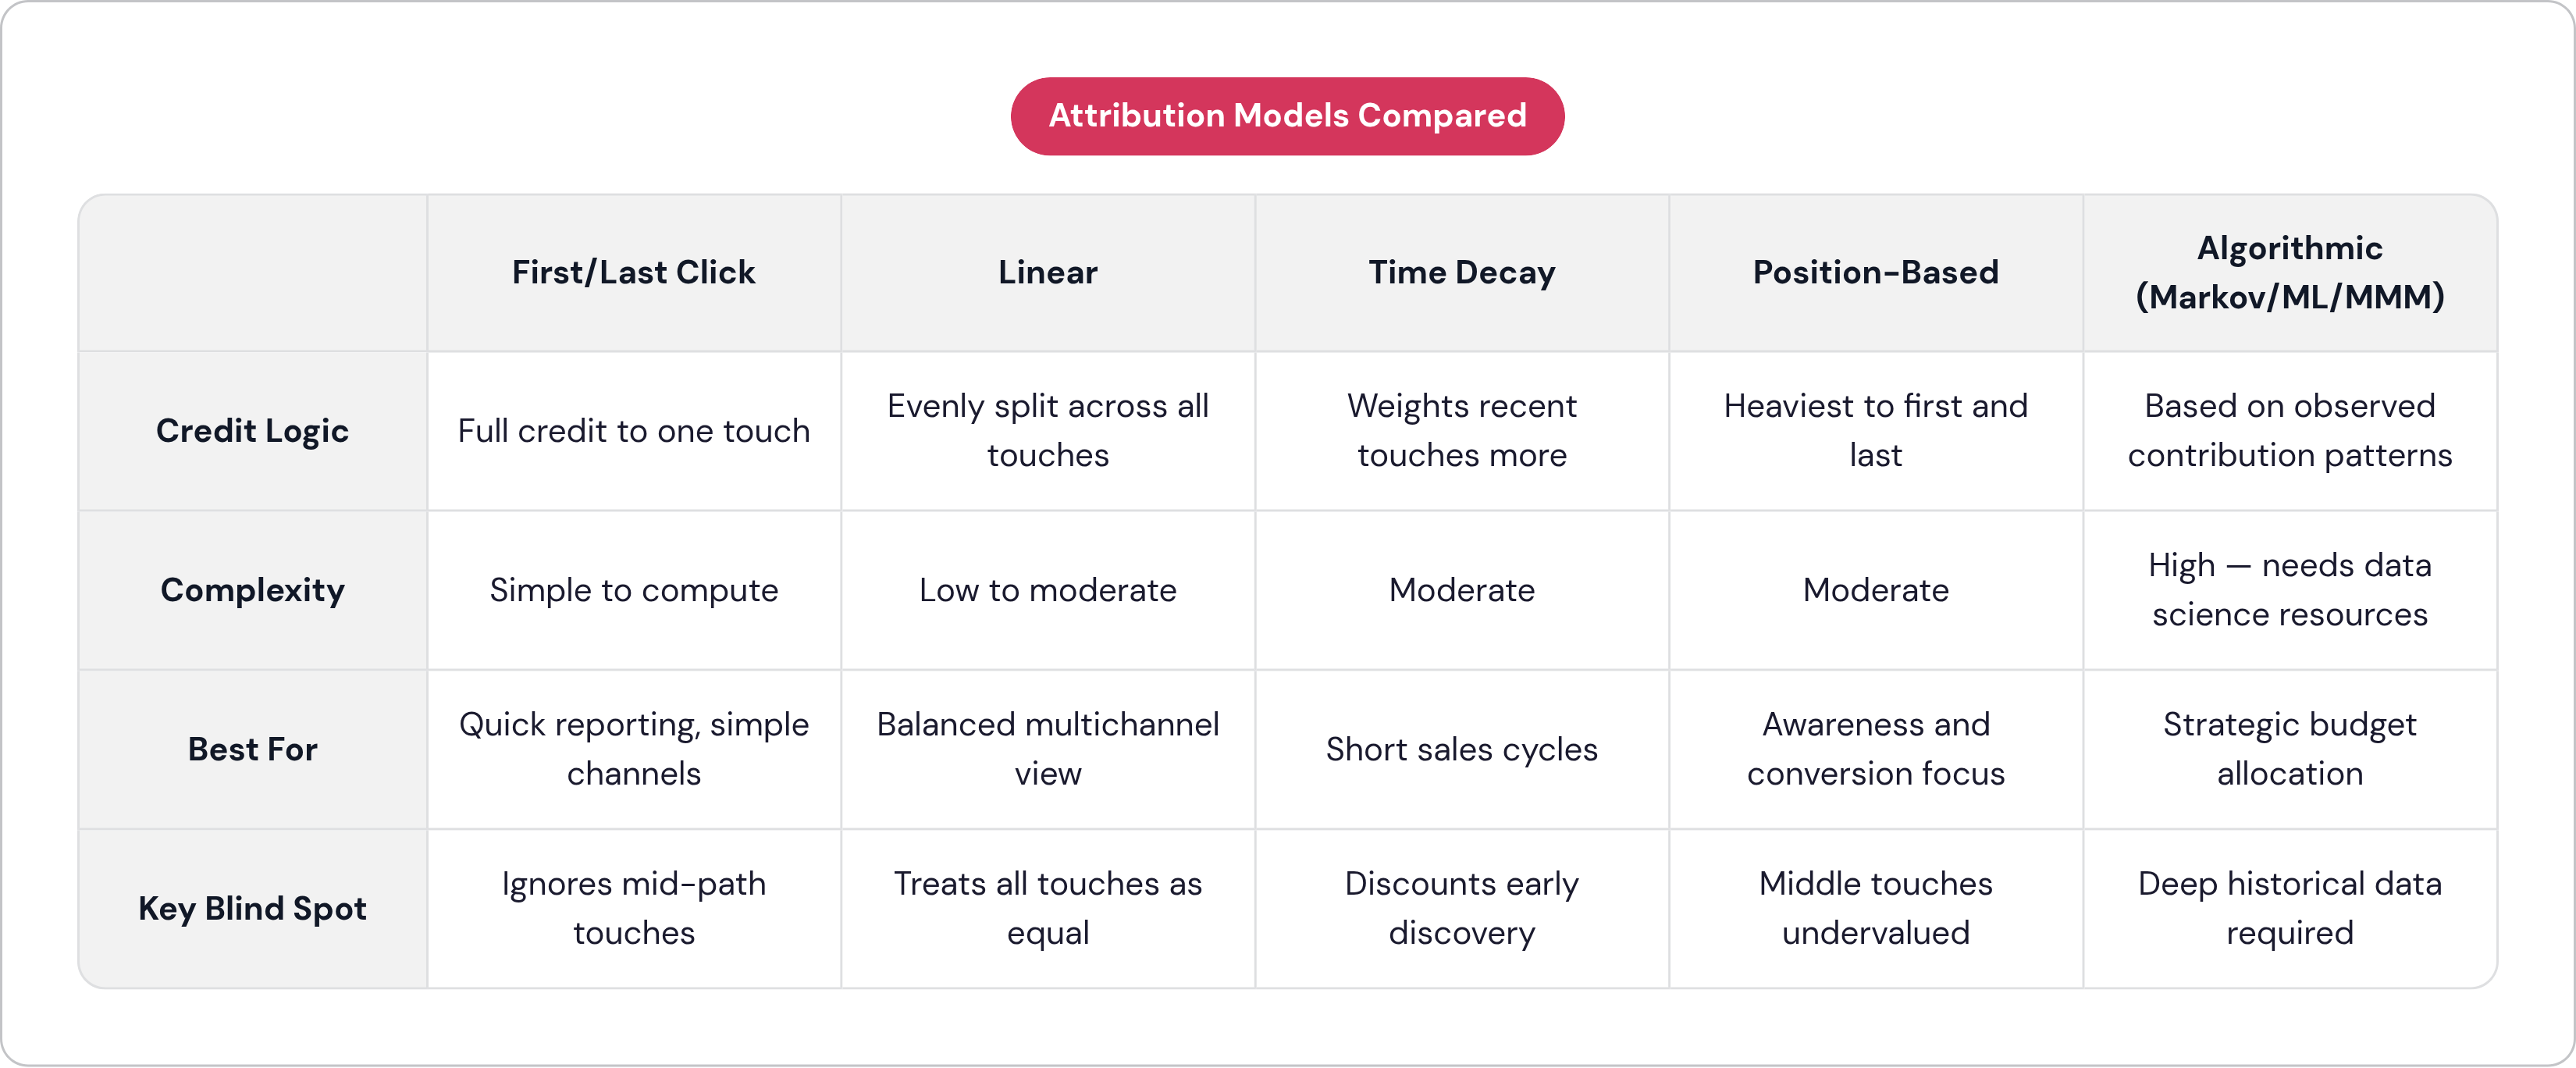
Everything above assumes you can trace outputs back to inputs. Attribution is the layer that actually does that: it assigns credit, often fractional, to the touchpoints responsible for each stage transition and the eventual conversion. Without it, you know the funnel moved, but you have no idea what moved it, which is a strange thing to be at peace with if you're the one signing off on the ad budget.
Single-touch models, First Click and Last Click, give full credit to one interaction. They're easy to explain, easy to compute, and blind to the reality that most B2B buyers touch a company eight or ten times before signing anything. Multi-touch models spread credit across the path: Linear splits it evenly, Time Decay weights recent touches more, and Position-Based (sometimes called U-Shaped) weights the first and last touch heaviest while spreading the remainder across the middle. Then there's the algorithmic tier: Markov chains, machine learning approaches, Marketing Mix Modeling, which assign credit based on observed contribution patterns rather than a formula somebody picked because it felt fair at the time.
Adoption stays uneven. 41% of marketers still rely on last-touch attribution, even though 75% now use some form of multi-touch model, according to whatconverts.com data. Those numbers don't add up to a clean split, since plenty of teams run more than one model depending on the report, but the takeaway holds: a meaningful chunk of the industry runs the computationally weakest version of credit assignment and calls it done.
Multi-touch attribution and Marketing Mix Modeling are tools built for different jobs. MTA is granular, user-level, close to real-time, good for tweaking bids and reallocating ad spend this week. MMM is aggregated, factors in things outside your dashboard like seasonality or a competitor's ad campaign, and needs a deep stack of historical data. That makes it better suited to strategic budget calls and to measuring offline channels MTA can't see at all. Incremental lift studies act as a third leg, useful for validating what the other two are telling you, an approach Adswerve's 2026 guidance points to as a check against both.
Getting this right pays off. McKinsey's 2024 Digital Marketing Analysis found organizations implementing multi-touch attribution report meaningful budget reallocation across channels and real CAC reductions from a better channel mix. But there's a structural wall in the way: privacy. GDPR compliance concerns, paired with the simple fact that a lot of mid-market firms don't have a dedicated Marketing Operations role to own this work, are the primary barriers to rigorous attribution, according to Gartner's 2025 research. The data the model wants is getting harder to collect at the individual level, so the attribution layer has to get smarter with less, not more.
How the instrumented funnel is acted on, not just observed
A dashboard shows you where the leak is; a computational model tells you which valve to turn, and by how much. Most companies have dashboards; far fewer have models, and the gap between the two is where a lot of marketing budget quietly goes to waste.
Break it down by stage. TOFU underperformance usually means a traffic volume or quality problem, and attribution data tells you which acquisition channels are actually filling the pipe efficiently versus just generating clicks that go nowhere. A MOFU stall is a velocity problem: either your scoring thresholds are miscalibrated, or your nurture cadence is off. Remember that 21-attempt average from earlier? It suggests most teams aren't limited by how many touches they're willing to make. They're aiming those 21 touches at the wrong people. BOFU drop-off tends to be friction or fit, whether that's checkout flow, page load speed, or an offer that doesn't match what the buyer actually asked for. Post-funnel churn shows up first as health score deterioration, which, if the model's built right, flags the account as at-risk before it walks out the door instead of after.
None of this matters much if a human has to manually interpret every signal before anything happens. Automation is the execution layer that makes decision rules, score thresholds, attribution weights, and churn flags actually trigger something: an email sequence, a sales alert, a shift in ad spend. A model that needs a person to read a report and then go do something by hand has given up its main advantage, which is speed. Global spending on marketing automation keeps climbing fast, and that's organizations voting with their budgets that operationalizing this stuff beats admiring it in a slide deck.
Content strategy belongs in this loop too, feeding the model actively rather than sitting off to the side as passive material. Content mapped to stage-specific intent generates a usable scoring signal in the first place, while content built without funnel position in mind adds static to a system already working hard to filter noise.
So is all this worth the upkeep, for something that used to be three boxes and an arrow? Stage entry criteria need defining and redefining, conversion rates need auditing against benchmarks that shift as AI search compresses buyer behavior into single sessions, and attribution weights need revisiting as channel mix changes. I'd love to tell you this stuff stays fixed once you've built it, but it doesn't; you're back in the spreadsheet in a month either way. An instrumented funnel that gets tuned regularly beats a narrative funnel that gets reviewed once a quarter and nodded at in a meeting nobody remembers by Friday.