Performance marketing is a payback function, not a channel: write the unit economics as code before the first ad spend
Encode what a customer is worth and what you can pay.
Performance marketing is a payback function. Before the first ad spend, a business needs to encode what a customer is worth, what it can afford to acquire one, and when spending must stop. Writing those rules as a small piece of code or config turns channel selection into a test of unit economics.
Why performance marketing fails before the first ad is bought
Founders often start with how much revenue they want and which channels to use. But the number that determines survival is payback speed. What can a customer cost and still return the cash soon enough to fund the next customer? Without a written answer, spending can grow as CAC rises, until thin margins can no longer cover the increase and cash runs out before lifetime value arrives. The mechanism is the same in DTC and B2B SaaS, whatever channel delivers the traffic.
That cash gap is not a minor detail. Median B2B SaaS CAC payback is measured in months, leaving a long interval between buying demand and recovering its cost. If the payback function is unwritten, the business has no clear rule for when to stop during that wait. The fix starts before campaign setup, with an explicit function that defines affordable acquisition and can govern spending.
Payback as a function: the inputs and the max affordable cost per click
The function needs average order value or ARR per customer, gross margin percentage, estimated click-to-lead and lead-to-customer conversion rates, an LTV window, and target payback months. These inputs describe value, probability, and time. Given those assumptions, the arithmetic is deterministic, even though the assumptions themselves remain uncertain. Its most useful output is the maximum affordable cost per click.
The first relationship is simple enough to write directly into code.
Cost per conversion = CPC ÷ conversion rate.
So a cheap click can lead to an expensive conversion when few visitors convert. Inverting the relationship gives the bid limit.
Max CPC = target CPA × conversion rate.
If target CPA means an affordable lead cost, the relevant rate is click-to-lead. If the target means an affordable customer cost, the calculation must include lead-to-customer conversion as well. If the conversion rate stays the same, paying more than that maximum pushes acquisition cost over the target.
For a first-order purchase, the break-even calculation is equally direct.
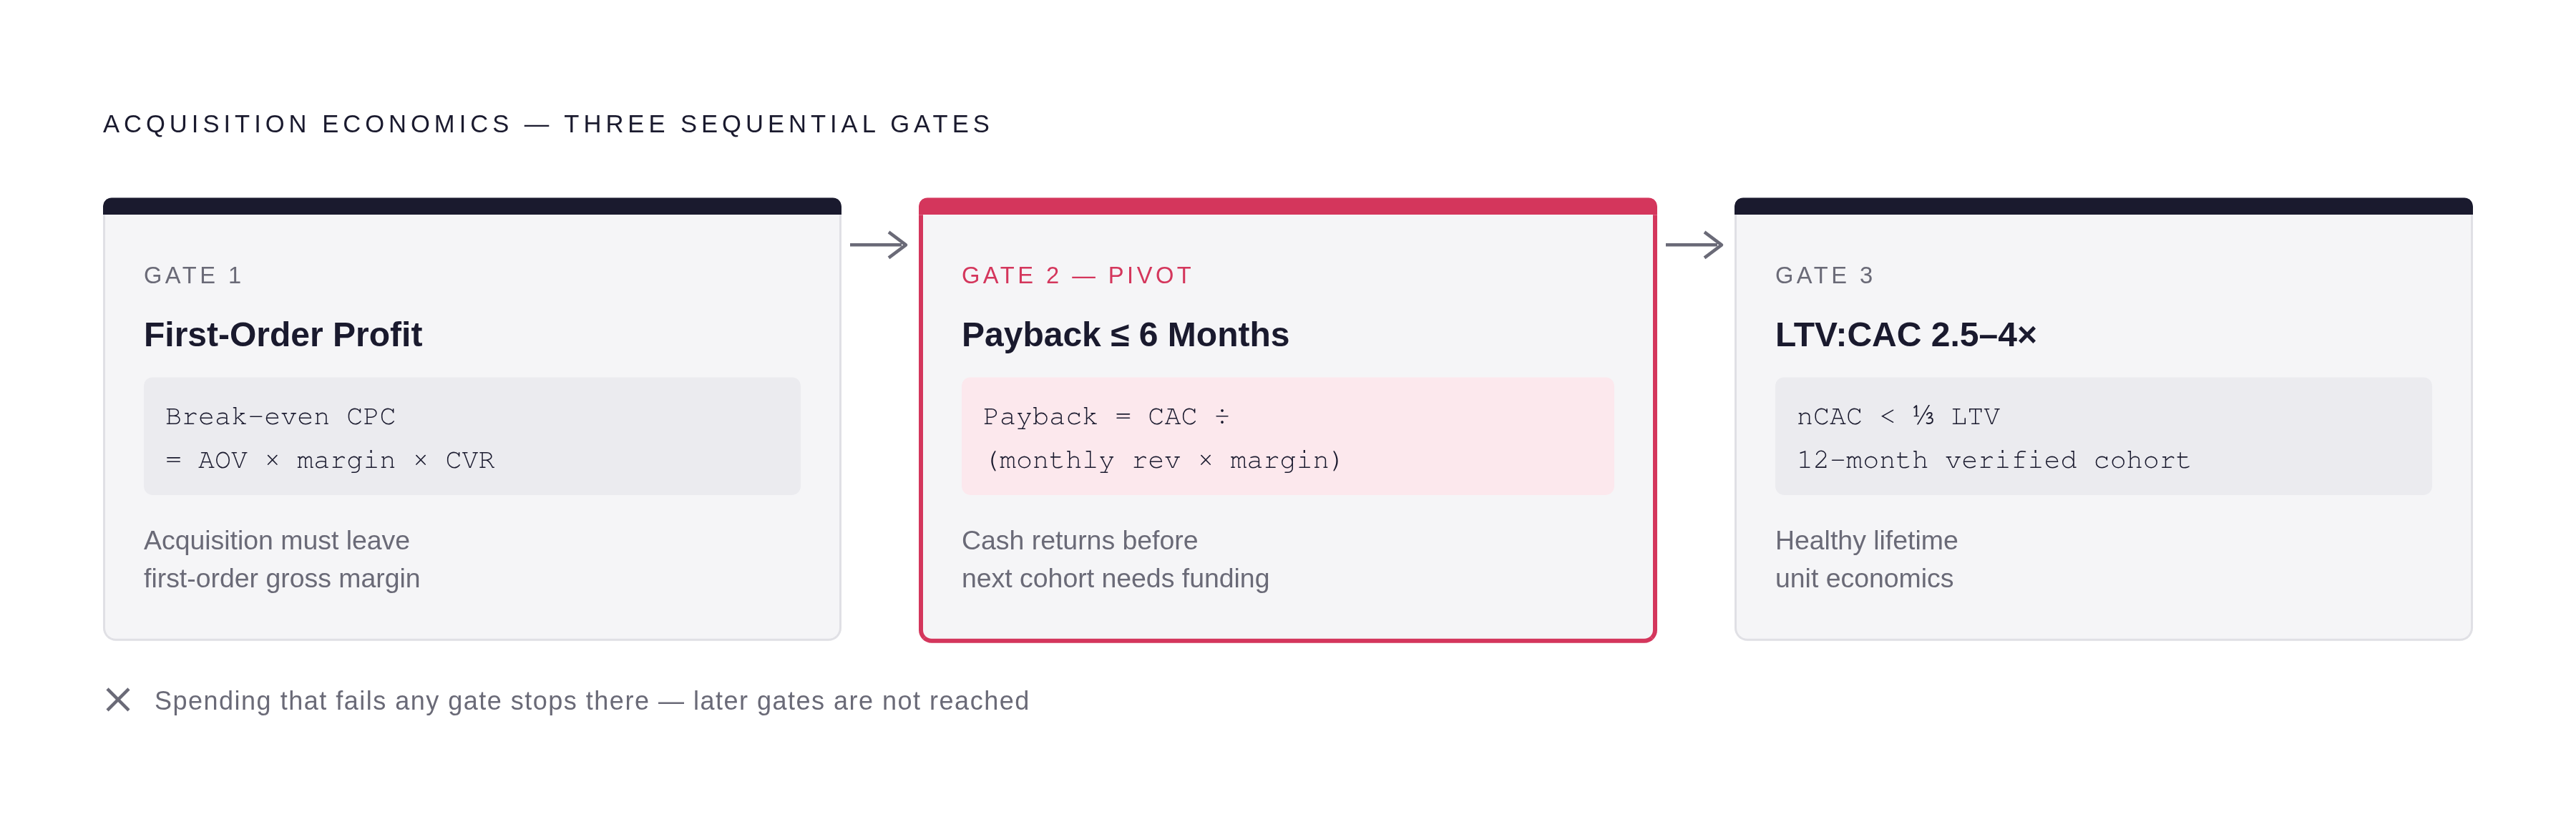
Break-even CPC = AOV × gross margin × conversion rate.
Here the conversion rate is click-to-purchase, because order value belongs to a purchase. Below that CPC, the acquisition leaves some first-order gross margin. Above it, acquisition consumes more than that margin. This is a first-order test, rather than proof that every cost of the business is covered.
For recurring revenue, what the business can afford also depends on how soon it earns back the acquisition cost.
Payback Period (months) = CAC ÷ (avg monthly revenue per customer × gross margin %).
The target payback period therefore constrains affordable CAC. Projecting a longer lifetime does nothing to bring cash in sooner. The framework has three gates: first-order profitability, payback under 6 months, and nCAC under roughly a third of contribution LTV.
A healthy LTV:CAC range is 2.5:1 to 4:1 on a 12-month verified-cohort basis, with LTV measured as contribution margin. Revenue alone can flatter a low-margin customer relationship. A 36-month projection may make today's CAC look affordable while hiding how much cash the business needs to get that far. Keeping the working view to 12 months makes it harder to stretch that assumption.
Industry averages can help put the numbers in context, but they cannot tell the business what its own maximum CPC should be. Before launch, its estimates must be explicit. As measured results arrive, the function can use them instead. A spreadsheet updated quarterly cannot pause a campaign at 11pm on a Thursday, while an encoded function connected to campaign controls can.
A click, a lead, and a customer as three instrumented events
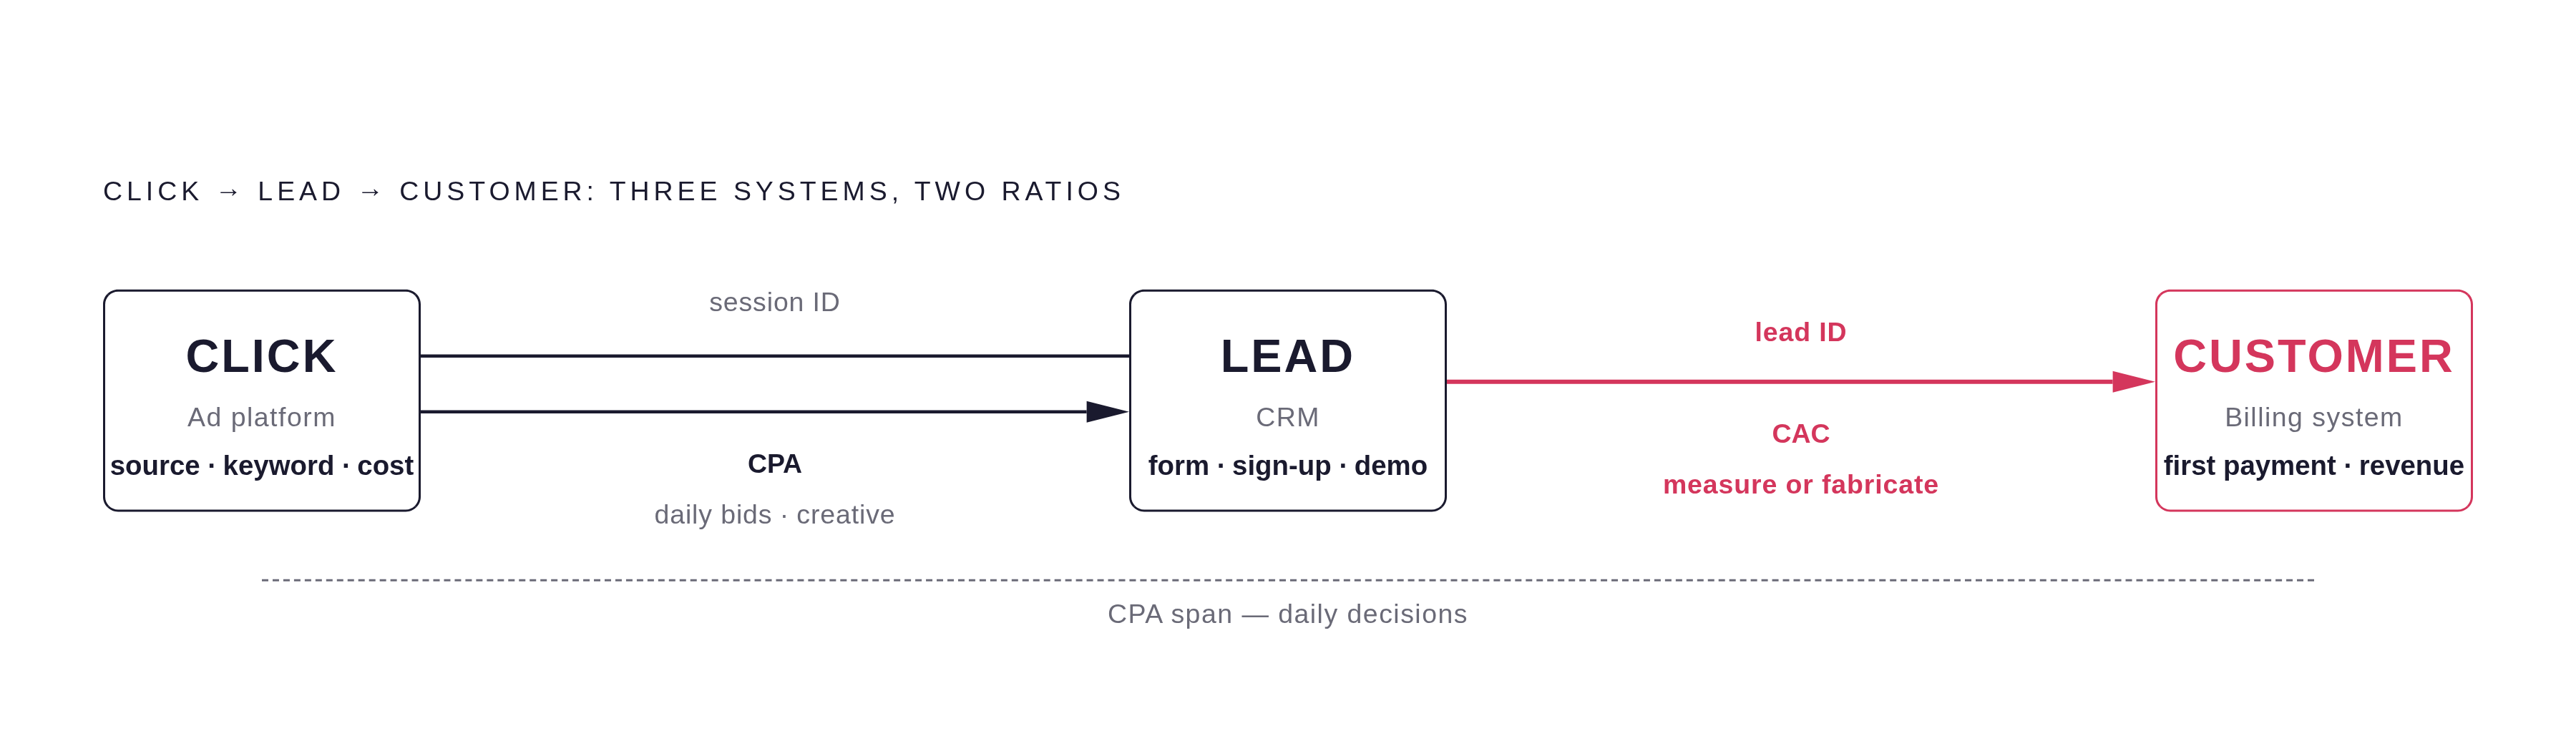
A click is not a customer in waiting. Collapsing clicks, leads, and customers into one platform “conversion” produces a cost whose meaning is unclear and leaves the payback calculation without a reliable denominator. Each event needs its own timestamp and system of record, with a connection to the next event.
The ad platform records the paid visit, including source, keyword, creative variant, and cost. The CRM records the lead, such as a form completion, sign-up, or demo request, tied to that visit's session ID. The billing system records the first paid transaction and its revenue amount, tied to the lead ID. Those links form the measurement chain. They let the business distinguish buying attention from generating interest and collecting revenue.
That distinction changes which metric answers which question. CPA derived from clicks and leads supports daily bid and creative decisions within a validated channel. CAC derived from clicks and customers supports monthly channel budgets and comparisons with LTV or payback. More leads do not automatically produce more customers. Separate lead and customer events reveal when raw volume grows without a matching increase in qualified pipeline.
In B2B, the customer event may follow the lead by weeks or months. The measurement chain must preserve that gap. Firing a conversion at form submission does not shorten the sales cycle, even if it makes the dashboard look complete. Source also needs to remain attached to the events from the start, because blending organic customers with paid customers can make paid acquisition appear cheaper than it is.
A pre-launch tracking check: follow one real lead into the report
Before launch, test the chain with one identifiable lead. Submit a test lead using a recognizable email, then follow that individual record from the ad platform through the CRM into the analytics report. Compare its timestamps and source attribution across those records. Where a paid transaction exists, reconcile its revenue amount with billing and the report.
A lead is not yet a closed deal. If the sales cycle is still open, the report should preserve that state. Treating an ad-platform conversion as a revenue result without tracing it to a closed deal in the CRM is a tracking failure. That disconnect can inflate reported ROAS and understate true CAC. It resembles unreviewed content reaching production, where an output looks finished until someone inspects its source.
This walkthrough should gate every new campaign or channel. Tracking can break without a visible warning. Automated checks for source matching, event deduplication, and consistent attribution windows catch mechanical errors, while a human following one record can expose a broken relationship between systems. Both are needed because an event can be technically valid and still stand for the wrong business outcome.
A CFO needs CAC payback, LTV:CAC, and pipeline coverage rather than a platform total that cannot reconcile to closed revenue. A CRM-connected reporting layer supplies the bridge between those views. If the test record cannot be followed end to end, the function's inputs are still unmeasured. Its maximum CPC and stopping rule would then be arithmetic on guesses.
A spend cap and a written kill rule
The function needs both a cap and a written condition for stopping. The cap ties the cohort budget to the number of customers expected and the maximum affordable cost of acquiring each one.
Total spend in a cohort period ≤ expected customer count × max CAC.
That relationship makes the cap an output of the economics. It also makes the customer-count assumption visible. If the expected count has no connection to measured conversion rates, the budget has inherited that uncertainty. The cap sets a limit on spending, but a separate rule must act when acquisition costs too much.
The kill rule is explicit. If rolling 7-day CAC exceeds max CAC by more than N% for M consecutive days, pause all campaigns and require human review before resuming. The team sets N and M before launch, while it can still talk about failure without feeling pressure to explain away poor results. A weekly review sets a schedule for reviewing results.
Why not enforce the LTV:CAC ratio alone? Because the ratio leaves out the cash clock. A brand with 3-month payback can recycle marketing dollars multiple times a year, while one with 14-month payback needs external capital to support growth and is exposed to a sustained CAC spike. The rolling window gives the kill rule a time dimension that a point-in-time ratio lacks.
The economics need repair before scaling when contribution margin, LTV:CAC, or CAC payback breaks its healthy threshold. When payback takes more than 12 months, growth needs outside funding and is at risk if acquisition costs rise or platforms suffer shocks. The stopping rule can limit that risk only if it gets data the business can trust. A rolling 7-day CAC rule needs a pipeline that can produce rolling 7-day CAC and keep the lead-to-customer delay in view.
This is where the parts become one closed loop. The function prices the three events, the pre-launch check tests their connections, and the kill rule turns the resulting measurement into a spending constraint. Without instrumented customers, the rule cannot judge CAC. Without the function, those events have no affordability test, and without the written rule, a failed test need not stop spending.
What the payback function cannot measure — and why that raises the cost of everything it can
That loop still has an upstream blind spot. It can price the acquisition events it instruments, but not the AI answer-engine conversations in which buyers increasingly form shortlists. A brand absent from those answers may be excluded before a search or an ad click. Paid channels then have to acquire customers without the pre-formed preference that an earlier mention could have created. The function can register higher CAC without identifying that missing influence.
Generative Engine Optimization, or GEO, is the practice of structuring and publishing content so AI answer engines cite it in their responses. A 2023 research paper by researchers from Princeton University, Georgia Tech, the Allen Institute for AI, and IIT Delhi introduced the term. Relevant engines include ChatGPT, Perplexity, Google AI Overviews, Gemini, and Claude. This is not simply another name for SEO. Ranking on a search results page and earning a citation in an AI answer are different jobs, so success at one does not establish success at the other.
The measurement counterpart is Share of Model, or SoM.
Share of Model = brand mentions ÷ total brand mentions in a tracked query set.
This visibility score asks whether a brand appears in the AI answers relevant to its buyers. It does not turn those conversations into attributed customer events. Instead, it measures a separate condition that can affect the acquisition economics downstream. As with rolling CAC, visibility should be measured.
Is GEO too new to spend money on separately? There is reason for that concern, especially because some AI answers cite no external sources. Yet comparisons, reviews, and vendor selection are among the categories where grounding is most likely and where B2B and DTC buying decisions take shape. Absence there can create a present acquisition disadvantage. That acquisition disadvantage warrants measuring the visibility gap.
Supporting citation also requires a reliable publishing process. A structured pipeline can give research and drafting to AI agents while people keep control of strategy, quality review, and the choice of what to publish. That division supports a cadence without abandoning accuracy. It extends the same discipline upstream, where output alone is not evidence of a useful result.
The payback loop remains the constraint on paid growth. AI visibility adds context for costs the loop observes but cannot fully explain, without excusing a breach of the spending rule. The function must still be fed by distinct events, tested against a traceable record, and enforced when acquisition stops paying back.