Who reads all your channel tests together? A weekly cross-channel comparison is a query, not a meeting: one table of arrivals, source-tagged inquiries and a reallocation rule an agent can run
A single source-tagged table lets an agent propose budget shifts.

Reading channel tests together is a measurement problem before it is a management problem. Separate dashboards cannot provide a shared account of what worked. A single source-tagged table can, if it spells out its definitions, comparison rule and incrementality checks. That structure lets an agent prepare repeatable budget recommendations while leaving the final decision with a human.
Why no one reads your channel tests together — and why that is a structural problem, not a discipline problem
Someone presents three dashboards in a weekly review, and the numbers cannot agree. Each platform keeps its own conversion count, uses its own attribution window and has its own dashboard for reports. A comparison therefore becomes an exercise in reconciling claims rather than reading a shared record, even when everyone involved has prepared carefully.
AdBeacon’s 2026 attribution guide illustrates the problem with a buyer who sees a Meta ad, clicks a branded Google search and converts through a TikTok retargeting link. All three platforms can report a full conversion. The guide describes this as the designed behavior of platform pixels. Adding those reports together does not show how much business the channels brought in together.
The meeting then compresses the evidence into talking points. In that compression, the origin of a number can disappear, while the resulting decision becomes difficult to replay or audit. Which channel wins the next budget increase? Too often, it is the one with the most convincing self-reported result, rather than the strongest contribution in a deduplicated comparison. Better meeting discipline cannot repair that architecture.
What source-tagging actually means and why it is the prerequisite for any comparison
A source-tagged inquiry is a conversion event with a machine-readable label identifying its channel, campaign and position in the sequence of touchpoints that produced it. The event could be a demo request, a form fill or an inbound email. Without the label, two inquiries look alike. A shared file may contain both, but it cannot distinguish which test each belongs to or compare their sources reliably.
The minimum tagging schema therefore includes channel, campaign ID, touchpoint position and a normalized conversion timestamp. Channel names must also come from a controlled vocabulary, including organic, paid-search-brand, paid-search-nonbrand, paid-social, email and direct. Otherwise, the comparison depends on interpreting labels.
Touchpoint position is necessary because identifying a source is not the same as assigning it all the credit. The table uses a position-based default, with 0.4 assigned to the first touch, 0.4 to the last touch and the middle share distributed between intervening touches. That makes the allocation rule explicit. It does not establish whether a channel created demand that would otherwise have been absent, which requires a separate incrementality check.
What the single source-tagged comparison table looks like and what goes in each column
The comparison table is a flat, queryable file, either a database view or a spreadsheet. Its rows represent source-tagged inquiries, and its columns describe measurements. Consider three illustrative rows drawn from organic, paid-search-nonbrand and email. Each records an inquiry under the same schema, so the reader can compare sources without translating three reporting systems.
The inquiry_id column identifies the conversion event, while timestamp records its time in UTC. The channel column uses the controlled vocabulary, with other for sources that fall outside the named categories. The campaign_id identifies the specific test being tracked. Identity comes before aggregation in this structure. The three illustrative rows remain distinguishable even when the weekly query groups them by channel.
The path_position column records first-touch, mid-touch or last-touch, and attributed_credit records the fractional allocation from the position-based rule. The table also has normalized_roas and platform_reported_roas, so the gap between normalized measurement and platform self-report stays in view. Click-only windows strip out view-through inflation from the normalized measure. Finally, week_number uses the ISO week so that records are grouped the same way in each weekly comparison.
The specified calculation for normalized_roas is spend divided by attributed revenue, but the proposed rule treats higher values as better. Those directions conflict. A team using this specification should settle that definition before enabling recommendations, because a deterministic query will faithfully repeat an inverted comparison.
The table is generated on Monday morning for the prior seven days. That weekly grain matches tactical budget shifts. The team decides on broader channel reallocation and strategic forecast updates each quarter, so it need not rewrite the channel strategy with each weekly recommendation.
How the reallocation rule works and what makes it automatable
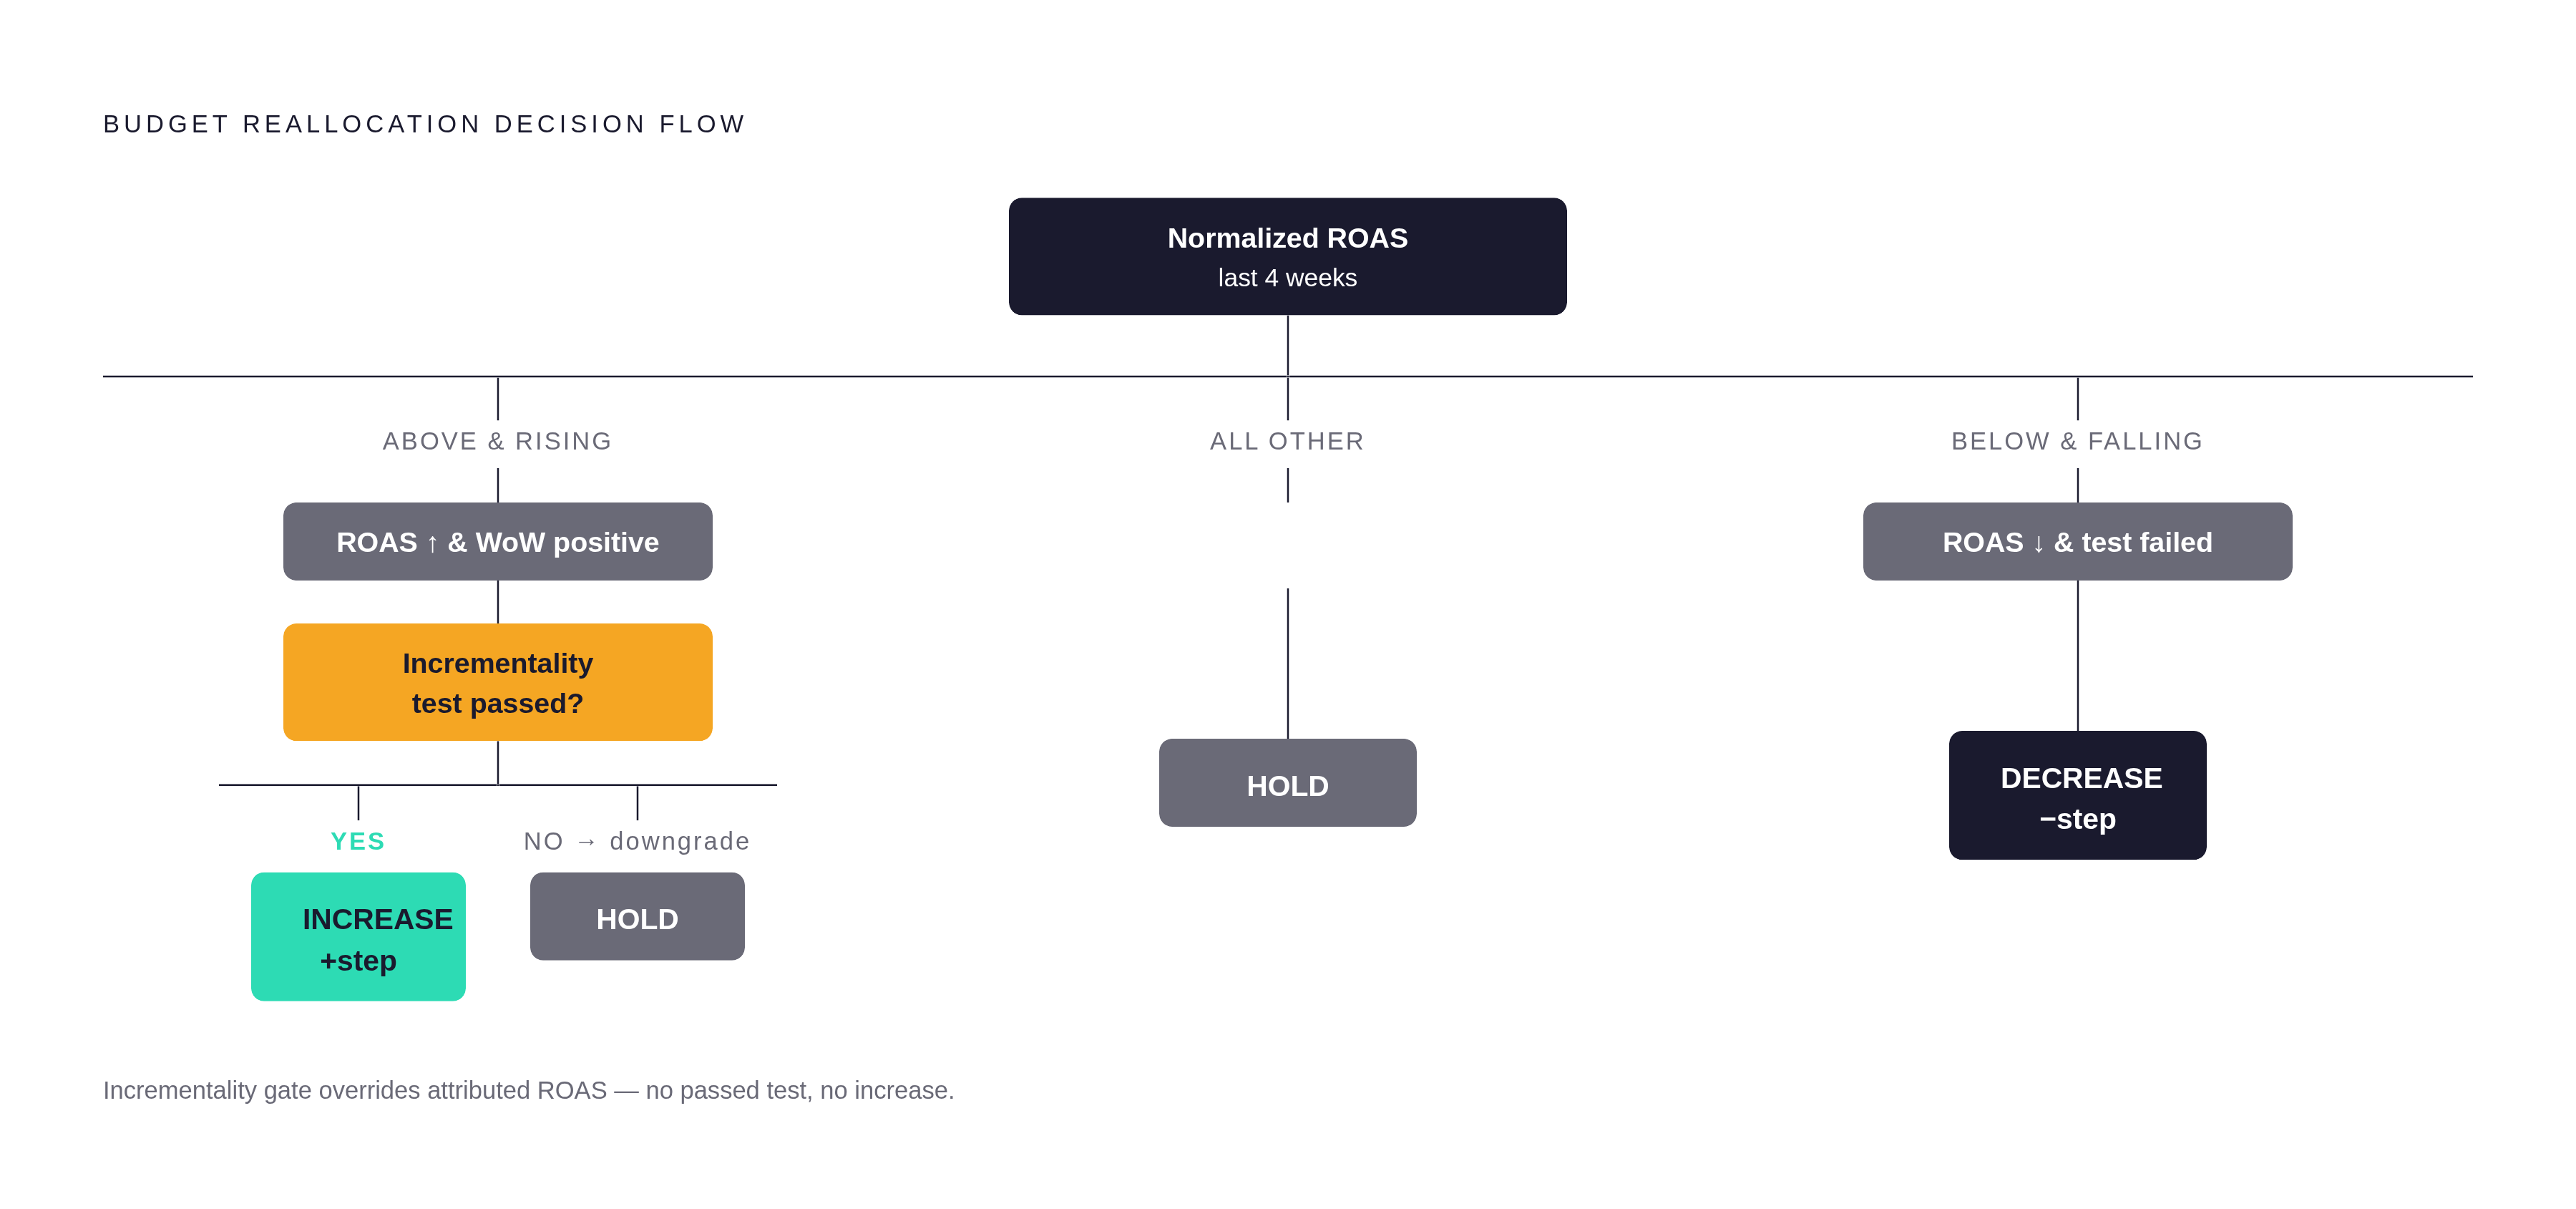
Once the metric’s direction is consistent with the comparison, the reallocation rule becomes a conditional statement over the table. Its increase branch is explicit. IF a channel’s normalized ROAS over the last four weeks is above the threshold AND its week-over-week change is positive AND its incrementality test passed, THEN increase its allocated budget by the defined step.
The reduction branch is equally specific. IF normalized ROAS is below the threshold AND declining AND the incrementality test failed, THEN reduce the budget by the same step. Otherwise, hold. A channel with good attributed results still needs a passed incrementality test to get an increase, because attribution alone cannot show that the spending added business.
The team sets the ROAS threshold and step size, then reviews those settings monthly. The blended account average is one possible threshold. The step size is a percentage of weekly budget, kept small enough that one bad week does not cause a dramatic shift.
AdBeacon’s guide calls for a separate brand-search budget line that matches demand and covers impression share on brand terms. Brand clicks can capture demand created elsewhere. Comparing their ROAS directly with prospecting would therefore reward the capture of existing demand as though it were the creation of new demand.
When the table, settings and gate results stay the same, the rule gives the same output. That is what makes it automatable. An agent can run the comparison on schedule and produce a diff showing each proposed adjustment and the evidence rows that triggered it. The proposal then goes to a human for approval or override before any budget changes, keeping the suggestion reviewable and reversible.
Why the cheapest test of whether the rule is working is a one-week platform pause
A platform pause tests how well the channel’s attributed results hold up when checked against business outcomes. But is one week the specified test? No. The pause procedure here calls for stopping all spend on one channel for two to four weeks, then comparing total business conversions against the prior period.
Those conversions come from CRM or revenue data. If total conversions do not fall meaningfully, the test indicates that the channel was not driving incremental results despite its reported performance. No special tooling is required for that comparison. The result feeds back into the table as incrementality_passed, a true-or-false column, so the agent reads a defined gate.
What the agent actually does on Monday morning and what the human reviews before anything changes
The Monday cycle begins with the pull. The agent queries the table for the prior ISO week, groups the results by channel and campaign_id, and computes normalized ROAS and week-over-week change for each grouped result. The time boundary is shared across the comparison.
Next comes the diff against last week’s snapshot. The agent flags channels whose normalized ROAS crossed the threshold in either direction, as well as channels whose week-over-week trend reversed. A crossing and a reversal are different signals. Showing both lets the subsequent rule distinguish a channel’s position relative to the threshold from the direction in which its performance is moving.
The third step applies the rule to the comparison, using its four-week condition as well as the weekly change. Each channel gets a recommendation to increase, decrease or hold, with links to the table rows that led to it. Any proposed increase without a recently passed incrementality test is downgraded to hold, preventing an attractive attributed result from bypassing the requirement for added business.
The fifth step puts that output into a packet for a human to review. It states which channels the rule recommends changing, by how much, which rows support the recommendation and what the incrementality check returned. Nothing changes merely because the packet exists. A human approves, overrides or defers each item before a budget adjustment is submitted to the platform.
That packet replaces the weekly reconciliation meeting because it arrives with the comparison already done. Scheduled queries can move optimization from monthly to weekly, reducing the time needed for the comparison from half a day to minutes. The saved time comes from making the inputs comparable and the decision logic repeatable.
If someone asks why a budget moved in a particular week, the recommendation points back to the rows that triggered it. Memory is no longer the only record. The human decision remains a distinct gate, while the calculation behind the proposed action can be inspected without reconstructing the meeting.
Why this system makes multi-channel testing compoundable when meetings do not
A review held in a meeting tends to start over each week because its conclusions are kept in memory or slides, with no link to machine-readable evidence. A query-based review accumulates snapshots that can be compared with later outcomes. That history makes the rule testable too. If an adjustment recommended in week eight has not produced better normalized ROAS by week twelve, the team has evidence for tightening the threshold or changing the step size.
Incrementality results accumulate in the same way. Each test adds evidence about which channels contribute additional demand and which capture demand shared with other channels. After several quarters, the channel model can rest on those observations. Because the comparison is a function, adding a channel, changing the attribution model or connecting another source can extend it without redesigning the weekly review.
AI answer-engine visibility could be another signal. Jasper’s GEO vs AEO vs SEO guide treats presence in AI-generated answers as a third distinct discovery layer that needs to be measured separately from SEO. A source-tagged comparison system has a place to absorb that measurement as a column.