An SEO report is a per-page table you can query, not a monthly document: join Search Console queries, page clicks and inquiries into one dataset, assert its completeness before reading it, and let the report end in a diff and a ticket
Join Search Console, analytics and inquiries per page, then test the data before trusting it.

An SEO report should be a per-page dataset that can be queried. Joining search visibility, page visits and inquiries helps teams use the report to decide what to do. Testing that dataset before interpreting it, then closing each change with an owned action, turns marketing reporting into an engineering discipline.
Why the monthly SEO report fails as an analytical instrument
A team pulls up a traffic chart, and someone asks, “So what should we do?” The chart has no answer on its own. It shows a change in visits, but not which page, for which query cluster, is gaining impressions without earning clicks. That gap is a structural defect. A summary has taken the place of the dataset needed to investigate it.
Google Search Console exposes clicks, impressions, CTR and average position, together with dates and dimension groupings. A monthly PDF collapses those dimensions into a view that often discards page identity. Once that identity is gone, the reader cannot connect search performance to what visitors did on a particular page or whether they made an inquiry. The missing link is the page URL. Reporting describes results for a period, while analytics investigates why they changed and which work deserves attention.
Choosing the right grain: one row per page URL per date
The first repair is to define what one row represents. That choice is the dataset’s grain, and every join and comparison depends on it. For this report, the grain is one row per page URL per date. The URL preserves page identity, while the date makes movement visible without reducing the whole site to a single trend.
Google’s Performance report documentation distinguishes six dimension axes, namely Queries, Pages, Countries, Devices, Search Appearance and Dates. Its aggregation table groups Queries, Countries, Devices and Dates by property, while Pages and Search Appearance are aggregated by page. This distinction changes what the numbers describe. Google also notes that chart totals can differ from table totals because of the aggregation used. Two views of the same property are not necessarily two views of an identical count.
A grain of one row for the whole site each week hides the page where a change happened. At the other extreme, a row for every query-page-date combination adds more rows and makes joins cost more without adding as much to what the analysis can show. Query detail still has a role in diagnosis. It does not need to define the reporting table’s grain. Define the grain in the schema, document it in the pipeline and prevent a dashboard from silently replacing it with a coarser view.
The join: connecting GSC query rows to page-click rows to downstream conversions
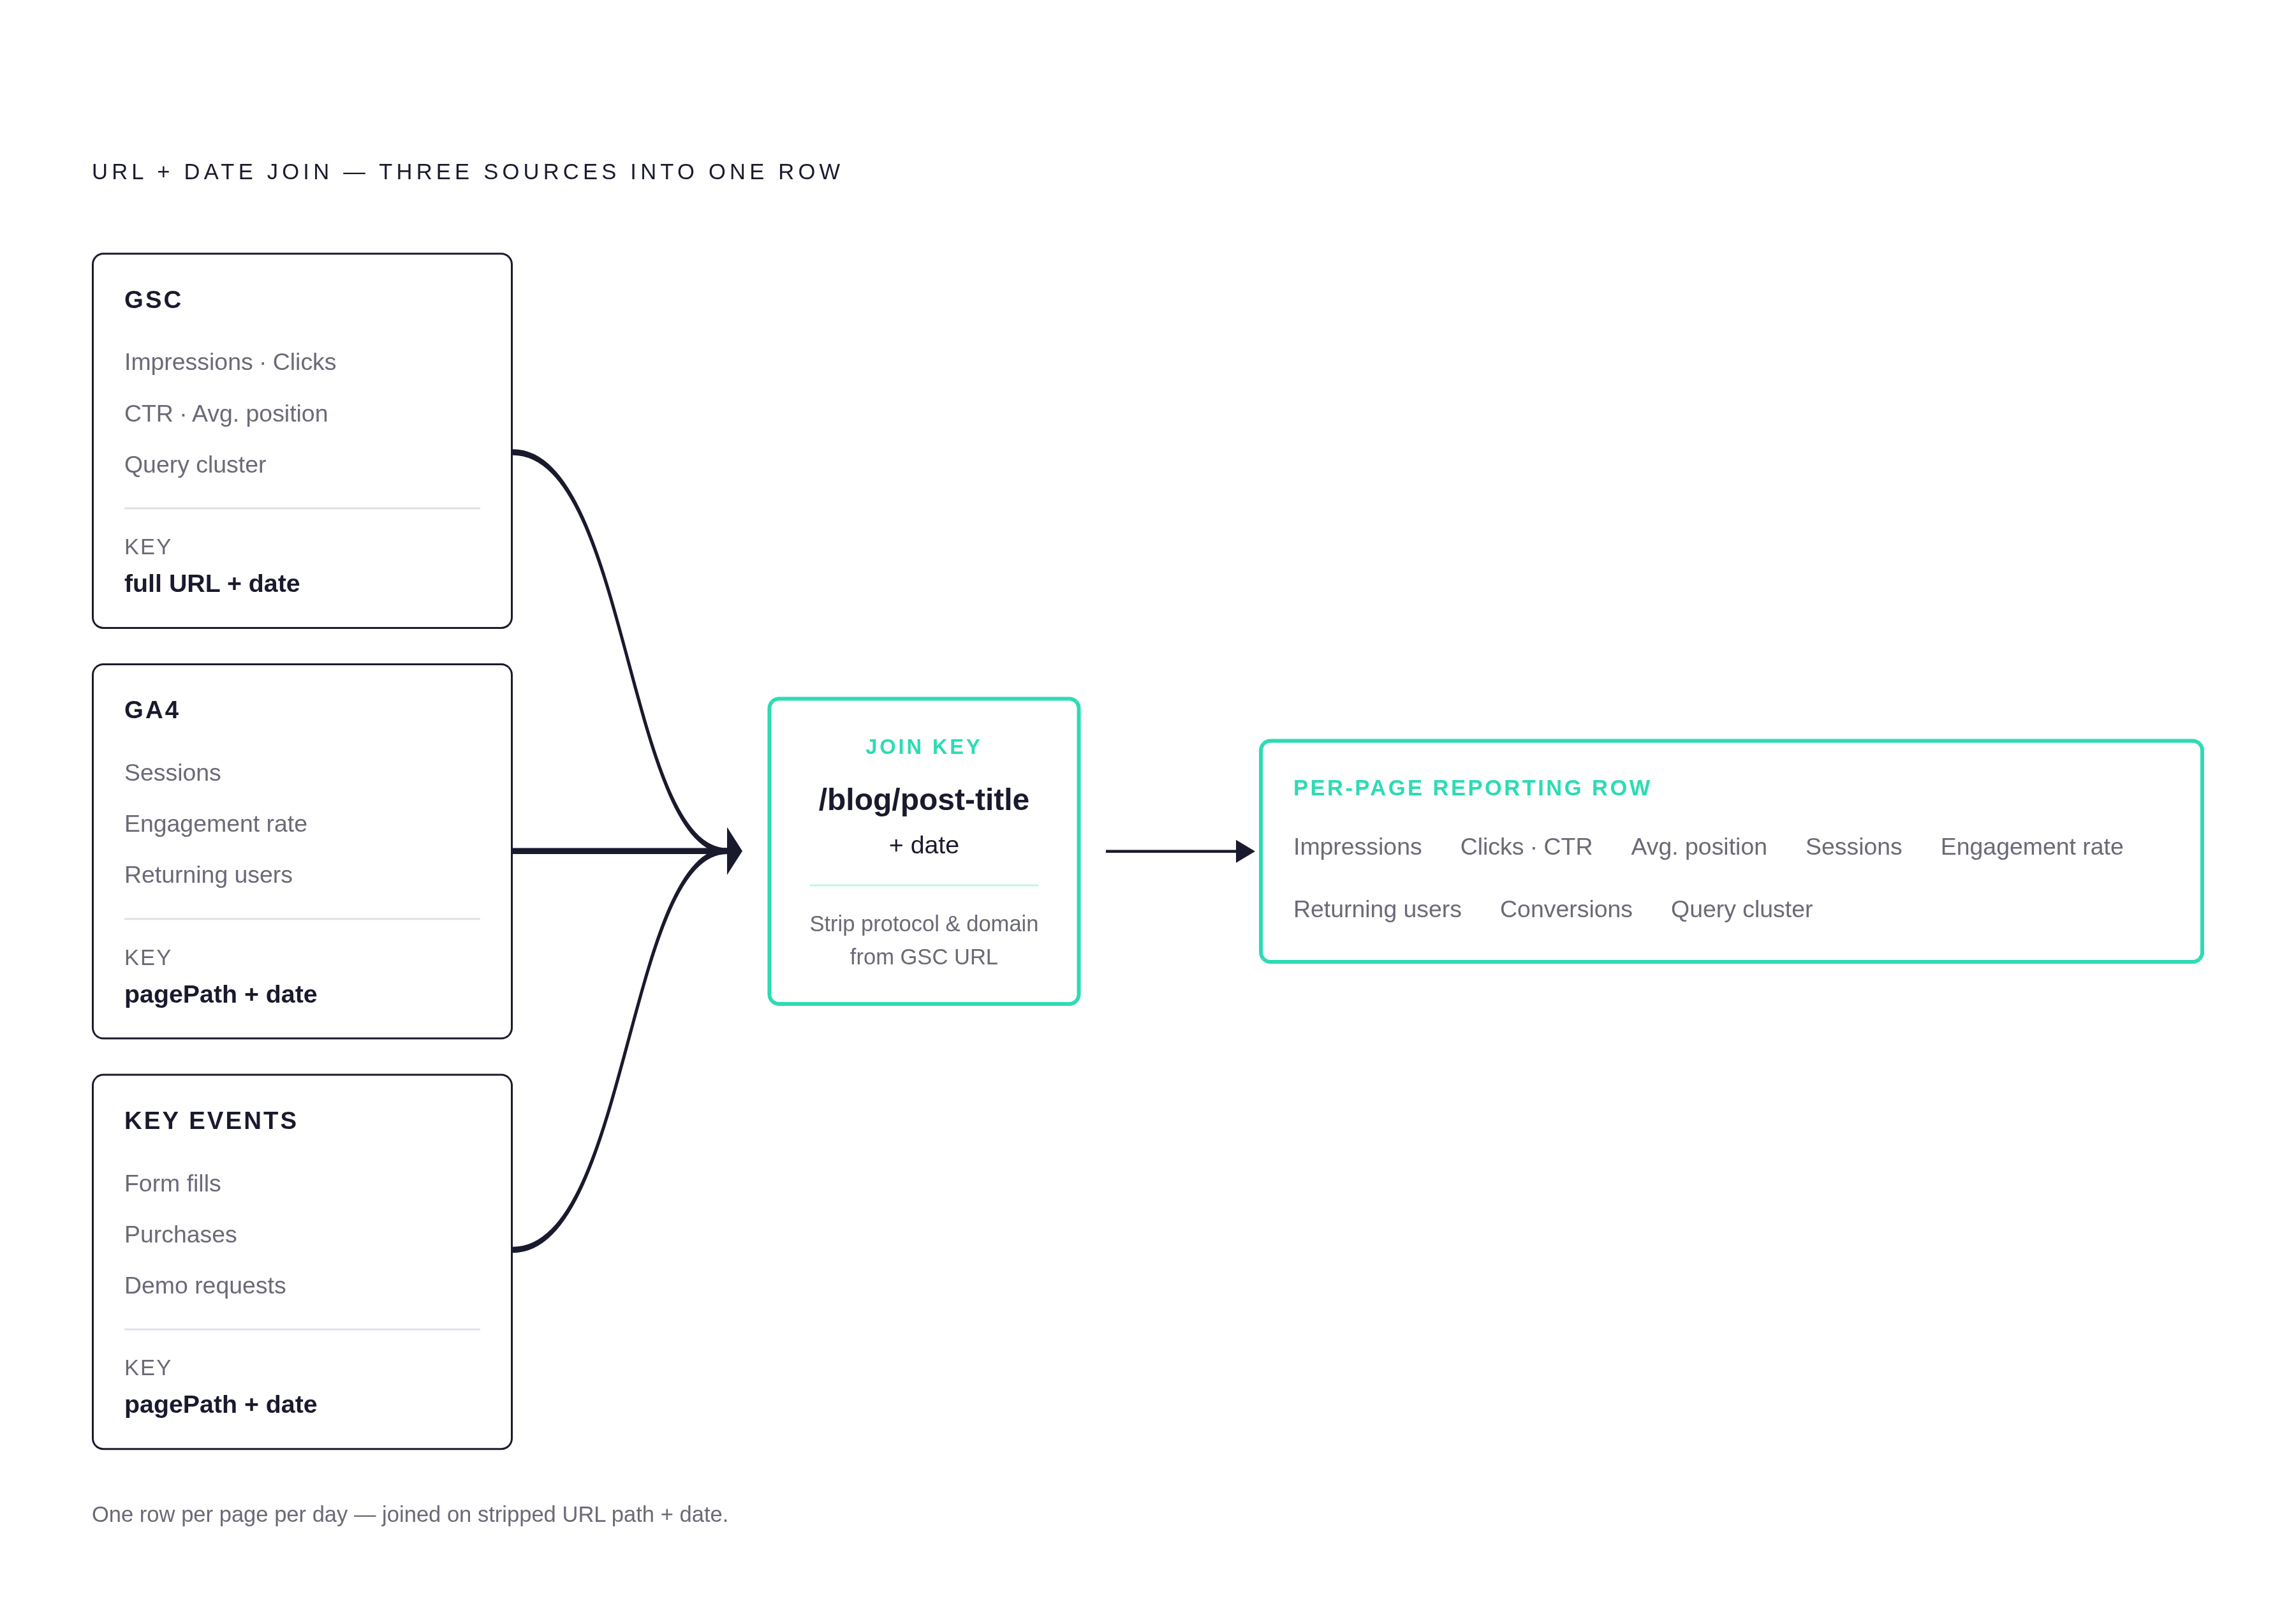
The page URL links discovery, behavior and outcomes, but each source writes that key in a different way. GSC stores a full URL, but GA4’s pagePath has a path such as /blog/post-title. For those fields to match, the GSC value needs its protocol and domain stripped away. The date must also remain part of the join. Otherwise, the resulting row no longer represents the page on a particular day.
Query detail belongs on the discovery side of this relationship. It shows which query clusters go with a page, while the reporting totals come from page-level clicks and impressions. Joining query rows directly to page-level sessions would break the chosen grain by repeating the page’s behavior data across queries. The data therefore needs page-level aggregation before the sources are joined into a reporting row. Nor can query text serve as the shared key, because GA4 does not store the visitor’s Google search query.
Each source then contributes a distinct part of the row. GSC supplies impressions, clicks, CTR, average position and query-cluster context. GA4 supplies sessions, engagement rate and returning users, while configured key events supply outcomes such as form fills, purchases and demo requests. Google’s guide to using Search Console and Analytics together names clicks and sessions as the most comparable cross-tool metrics, while explaining that they measure different stages and will not match exactly.
At scale, Search Console bulk exports to BigQuery provide the path for large-property joins that would otherwise run into API per-request row limits. Even at that scale, the definitions still need to work together. Views of each source on its own still help until their dimensions allow the data to be joined correctly. Once the data is joined, high impressions with low clicks can point to a meta description that needs work, while high clicks with few key-event completions point to the quality of the content or landing page.
Asserting dataset completeness before anyone reads a trend
A successful join is not proof of complete data. Google omits rare queries to protect searcher privacy, so listed queries do not sum to a page’s total clicks and impressions. Query and URL filters can also change totals because of truncation and missing queries. A filtered view is therefore not simply a smaller version of the unfiltered count. Assertions must account for these documented gaps rather than demand an equality the sources cannot provide.
The checks can stay concrete and short. A row-count check compares the import with its trailing average and treats a sudden drop as a possible export or truncation problem before calling it a traffic collapse. A totals check compares joined page clicks with an expected range around GSC’s property total, allowing for aggregation differences. Date coverage checks whether every expected date is there, and key-event coverage checks whether pages that converted in the past still have outcome data. Missing boundary dates and unexpected zeroes need to be checked before anyone draws conclusions from them.
GSC’s per-request row limit makes pagination with startRow part of that completeness check. Its most recent data can also be preliminary and change as collection continues. These are pipeline conditions. Automated assertions should block the report when they fail, just as a test suite blocks a deployment. A warning that lets the report proceed leaves readers free to turn a collection failure into a confident business conclusion.
What the AI search layer adds to the dataset — and where it breaks the join
Google’s dedicated Search Console generative AI performance reports for Search and Discover rolled out to all websites worldwide by August 31, 2026, with data beginning on May 18, 2026 and no earlier history. They show impressions for AI Overviews and AI Mode by page, country, device and date. They do not expose clicks, CTR or queries. The page can still be joined, but the missing search and click fields cannot be recovered by choosing better reporting software.
That gap also changes the unit being measured. Traditional SEO tracks position in a list of links, while GEO tracks a citation slot within a synthesized answer. A brand mention is not a citation. The model may name a brand without linking to its domain, or cite a page as evidence without making the brand as easy to notice. Treating those signals as one measure would conceal the distinction the dataset needs to preserve.
A separate AI-mentions table can keep the page URL and engine, with what it records on each date joined back to the per-page table. Its minimum log includes an inclusion flag, link URLs, placement order, competitor names present, timestamp, model and version, and locale. Placement can record first, middle or end. A brand-only mention has no cited page URL, so it cannot honestly be assigned to a page through the URL join. The measurement track must respect that limit and avoid making up a link to downstream conversions.
Why citation data is volatile and what that means for how you read the AI columns
Is citation data too noisy to belong in the report? One answer gives too little evidence to make a claim about ranking. The citations chosen change from one response or engine to another, so a snapshot can look more certain than the way the data was gathered allows. The useful object is a distribution of observations over a fixed prompt set. This makes citation measurement a stochastic pipeline problem.
In practice, that means running the fixed prompt set daily or weekly and reading inclusion rate and placement distribution across runs. Models and locales need their own views because putting them together can hide how their behavior differs. Non-citation is a baseline. Before interpreting a change, the assertion layer should check that the full prompt set ran, that recorded model versions match expectations and that each engine has enough observations for a meaningful rate.
What content structure does to citation rate — and why the ground site is still the asset
A low inclusion rate identifies a page to investigate, but it does not identify the failure stage. Malformed HTML and excessive surrounding noise can obstruct parsing. Truncation and poor ordering can keep useful material out of the available context. Even readable content can fail at generation because it lacks an entity, misses the intent or competes with a better-sourced claim. Citation loss is not always a ranking problem.
For writers and editors, the actionable response is to make the strongest evidence easy to reach and extract. Putting a citable claim early avoids burying it beneath less useful material. SE Ranking’s 2025 study found that mid-length, self-contained sections between headings outperformed very short sections in AI citation rate, while long, undivided sections reduced extractability. Section boundaries do real work here. They give the model a segment that can stand on its own as an answer.
Structure alone cannot give a page evidence it does not have. AI-generated text covers ground a model may already have taken in, while survey data, proprietary case studies and opinions from named experts in real conversations give it something different. The ground site remains the durable asset. It is the brand’s own published content, which it can keep fresh, structured and supported by evidence, while third-party distribution amplifies it. To connect that editorial work to measurement, the per-page diff should include a freshness flag and a structure flag alongside a traffic delta. Those flags make the report a bridge from a request to “improve content.” to a specific revision.
Closing the report with a diff and a ticket, not a summary slide
The report’s terminal output is a comparison between the current dataset snapshot and the previous run. That diff shows which pages have large changes in impressions, changes in CTR without a matching change in impressions, or high clicks with few key-event completions. It also records shifts in AI citation inclusion rate by engine, with freshness and structure flags attached. Lost citations need to be checked right away, including the distributional checks that tell a change from noise. Failed completeness assertions stop the diff altogether.
Every row then needs a disposition. It maps to a new ticket, an existing ticket that is linked, or a deliberate decision to do nothing with the reason recorded. A ticket states the action, who owns it, the success signal and the review date. Without those fields, the observation has nowhere to go. With them, a meta-description signal can become a bounded task whose result is measured after the change.
A continuous or weekly dataset keeps each diff small enough to act on, while a monthly document lets changes accumulate until prioritization consumes the discussion. The pipeline itself also needs to be measured through content velocity, the AI citation rate for content it produces, and organic traffic from that content compared with content produced by hand. A system that closes each diff with an owned decision and re-measures after the fix will compound its gains, because every run can turn the last change into evidence for the next one.